

Patrones actuales

Los patrones son modelos gráficos que se forman en el gráfico mediante el precio. Según uno de los postulados del análisis técnico, la historia (movimiento del precio) se repite. Esto quiere decir que los movimientos del precio a menudo son similares en las mismas situaciones que hacen posible pronosticar el futuro desarrollo de la situación con una alta probabilidad.
Los patrones relevantes de InstaTrade son un servicio fácil de utilizar que permiten que conozca los últimos cambios en el mercado y reaccione a las pistas del mercado a tiempo. En nuestro servicio, siempre encontrará los últimos y más importantes patrones en cualquier par y en cualquier marco de tiempo.
Head and Shoulders
was formed on 18.03 at 16:00:01 (UTC+0)
signal strength 3 of 5
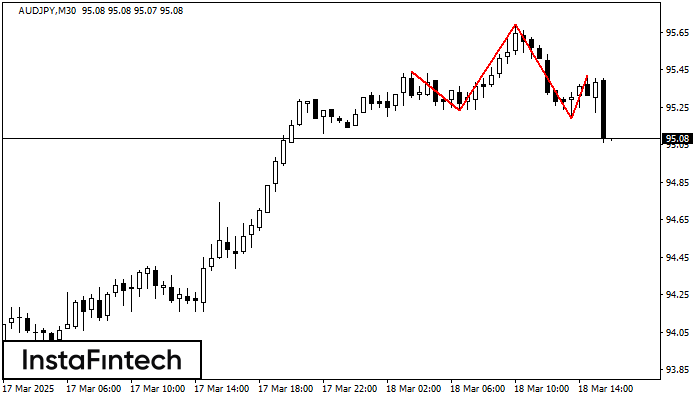
According to the chart of M30, AUDJPY formed the Head and Shoulders pattern. The Head’s top is set at 95.69 while the median line of the Neck is found at 95.23/95.19. The formation of the Head and Shoulders pattern evidently signals a reversal of the upward trend. In other words, in case the scenario comes true, the price of AUDJPY will go towards 94.89.
- All
- All
- Bearish Rectangle
- Bearish Symmetrical Triangle
- Bearish Symmetrical Triangle
- Bullish Rectangle
- Double Top
- Double Top
- Triple Bottom
- Triple Bottom
- Triple Top
- Triple Top
- All
- All
- Buy
- Sale
- All
- 1
- 2
- 3
- 4
- 5
Teratas Triple
was formed on 18.04 at 22:15:20 (UTC+0)
signal strength 2 of 5

Pola Teratas Triple telah terbentuk pada grafik EURUSD M15. Fitur-fitur pola: perbatasan memiliki sudut yang naik; batas bawah pola memiliki koordinat 1.1387/1.1391 dengan batas atas 1.1397/1.1397; proyeksi lebar adalah
Rangka waktu M5 dan M15 mungkin memiliki lebih dari titik entri yang keliru.
Open chart in a new window
Persegi Bearish
was formed on 18.04 at 21:51:06 (UTC+0)
signal strength 2 of 5

Menurut grafik dari M15, NZDCAD terbentuk Persegi Bearish. Jenis pola ini menunjukkan kelanjutan tren. Terdiri dari dua tingkat: resistance 0.8222 - 0.0000 dan support 0.8206 – 0.8206. Jika level resistance
Rangka waktu M5 dan M15 mungkin memiliki lebih dari titik entri yang keliru.
Open chart in a new window
Bawah Ganda
was formed on 18.04 at 21:45:06 (UTC+0)
signal strength 2 of 5

Pola Bawah Ganda telah terbentuk pada USDJPY M15; batas atas di 142.30; batas bawah di 142.14. Lebar pola sebesar 17 poin. Jika harga menembus batas atas 142.30, Perubahan dalam tren
Rangka waktu M5 dan M15 mungkin memiliki lebih dari titik entri yang keliru.
Open chart in a new window


