

Pola sebenarnya

Triple Top
was formed on 18.04 at 22:15:20 (UTC+0)
signal strength 2 of 5

The Triple Top pattern has formed on the chart of the EURUSD M15. Features of the pattern: borders have an ascending angle; the lower line of the pattern has the coordinates 1.1387/1.1391 with the upper limit 1.1397/1.1397; the projection of the width is 10 points. The formation of the Triple Top figure most likely indicates a change in the trend from upward to downward. This means that in the event of a breakdown of the support level of 1.1387, the price is most likely to continue the downward movement.
The M5 and M15 time frames may have more false entry points.
- All
- All
- Bearish Rectangle
- Bearish Symmetrical Triangle
- Bearish Symmetrical Triangle
- Bullish Rectangle
- Double Top
- Double Top
- Triple Bottom
- Triple Bottom
- Triple Top
- Triple Top
- All
- All
- Buy
- Sale
- All
- 1
- 2
- 3
- 4
- 5
Panji Bullish
was formed on 02.05 at 18:30:27 (UTC+0)
signal strength 4 of 5
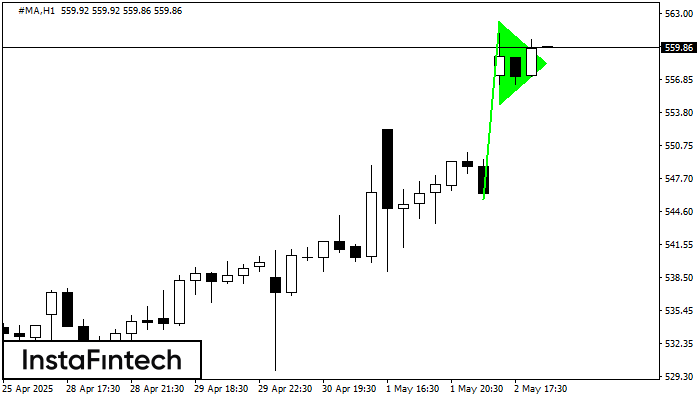
Pola grafik Panji Bullish telah terbentuk di instrumen #MA H1. Jenis pola ini terjadi pada kategori pola kelanjutan. Dalam kasus ini, jika kuotasi dapat menembus titik tertinggi, harga diperkirakan akan
Open chart in a new window
Persegi Bullish
was formed on 02.05 at 18:06:10 (UTC+0)
signal strength 1 of 5
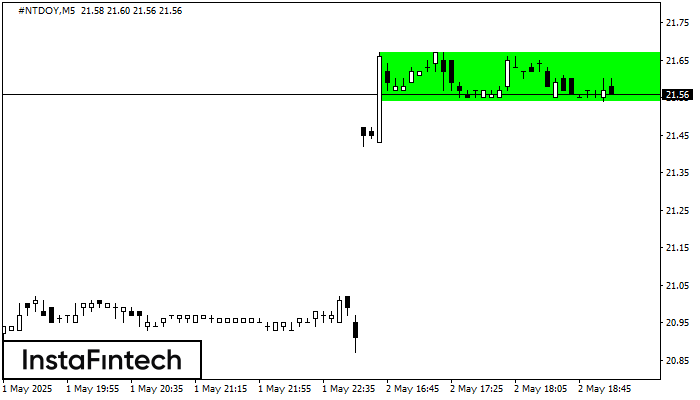
Menurut grafik dari M5, #NTDOY terbentuk Persegi Bullish. Pola menunjukkan kelanjutan tren. Batas atas adalah 21.67, batas lebih rendah adalah 21.54. Sinyal berarti posisi beli harus dibuka diatas batas atas
Rangka waktu M5 dan M15 mungkin memiliki lebih dari titik entri yang keliru.
Open chart in a new window
Persegi Bullish
was formed on 02.05 at 18:06:01 (UTC+0)
signal strength 1 of 5
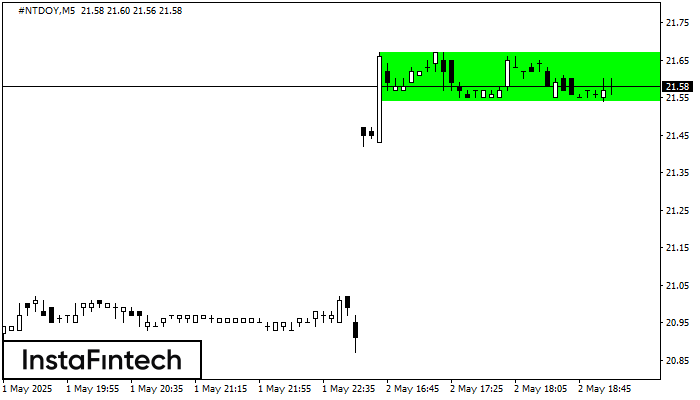
Menurut grafik dari M5, #NTDOY terbentuk Persegi Bullish. Pola menunjukkan kelanjutan tren. Batas atas adalah 21.67, batas lebih rendah adalah 21.54. Sinyal berarti posisi beli harus dibuka diatas batas atas
Rangka waktu M5 dan M15 mungkin memiliki lebih dari titik entri yang keliru.
Open chart in a new window


