

Pola sebenarnya

Bearish Rectangle
was formed on 18.04 at 21:51:06 (UTC+0)
signal strength 2 of 5

According to the chart of M15, NZDCAD formed the Bearish Rectangle. This type of a pattern indicates a trend continuation. It consists of two levels: resistance 0.8222 - 0.0000 and support 0.8206 – 0.8206. In case the resistance level 0.8206 - 0.8206 is broken, the instrument is likely to follow the bearish trend.
The M5 and M15 time frames may have more false entry points.
- All
- All
- Bearish Rectangle
- Bearish Symmetrical Triangle
- Bearish Symmetrical Triangle
- Bullish Rectangle
- Double Top
- Double Top
- Triple Bottom
- Triple Bottom
- Triple Top
- Triple Top
- All
- All
- Buy
- Sale
- All
- 1
- 2
- 3
- 4
- 5
Teratas Ganda
was formed on 02.05 at 21:50:15 (UTC+0)
signal strength 1 of 5

Pola reversal Teratas Ganda telah terbentuk pada USDJPY M5. Karakteristik: batas atas 145.09; batas bawah 144.90; lebar pola 18 poin. Transaksi jual lebih baik dibuka di bawah batas bawah 144.90
Rangka waktu M5 dan M15 mungkin memiliki lebih dari titik entri yang keliru.
Open chart in a new window
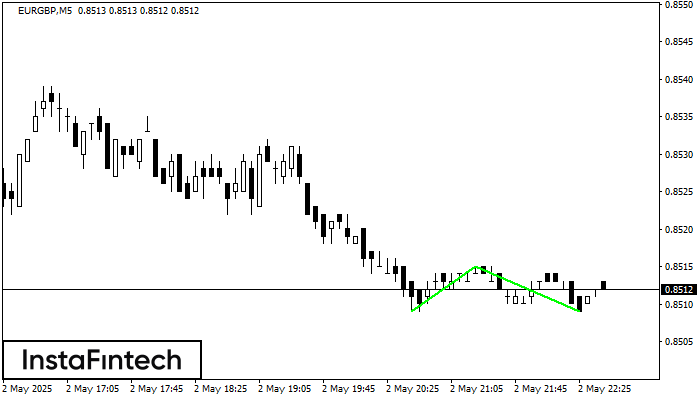
Bawah Triple
was formed on 02.05 at 21:45:21 (UTC+0)
signal strength 1 of 5

Pola Bawah Triple telah terbentuk pada EURGBP M5. Pola tersebut memiliki karakteristik sebagai berikut: level resistance 0.8515/0.8514; level support 0.8509/0.8509; dengan lebar 6 poin. Jika terjadi pemecahan (breakdown) pada level
Rangka waktu M5 dan M15 mungkin memiliki lebih dari titik entri yang keliru.
Open chart in a new window
Bawah Ganda
was formed on 02.05 at 21:40:51 (UTC+0)
signal strength 1 of 5
Pola Bawah Ganda telah terbentuk pada EURGBP M5; batas atas di 0.8515; batas bawah di 0.8509. Lebar pola sebesar 6 poin. Jika harga menembus batas atas 0.8515, Perubahan dalam tren
Rangka waktu M5 dan M15 mungkin memiliki lebih dari titik entri yang keliru.
Open chart in a new window


