

Actual patterns

Patterns are graphical models which are formed in the chart by the price. According to one of the technical analysis postulates, history (price movement) repeats itself. It means that the price movements are often similar in the same situations which makes it possible to predict the further development of the situation with a high probability.
Relevant patterns by InstaTrade is an easy-to-use service which allows you to be aware of latest changes in the market and react to clues from the market in time. In our service you will always find the latest and most relevant patterns on any pair and any timeframe.
Bullish Symmetrical Triangle
was formed on 07.04 at 05:17:14 (UTC+0)
signal strength 1 of 5
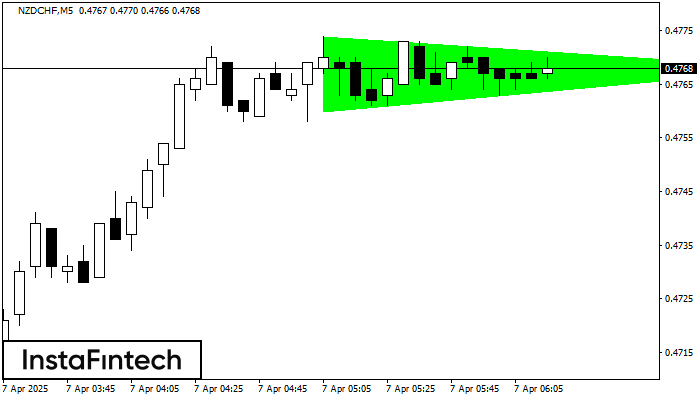
According to the chart of M5, NZDCHF formed the Bullish Symmetrical Triangle pattern. Description: This is the pattern of a trend continuation. 0.4774 and 0.4760 are the coordinates of the upper and lower borders respectively. The pattern width is measured on the chart at 14 pips. Outlook: If the upper border 0.4774 is broken, the price is likely to continue its move by 0.4783.
The M5 and M15 time frames may have more false entry points.
- All
- All
- Bearish Rectangle
- Bearish Symmetrical Triangle
- Bearish Symmetrical Triangle
- Bullish Rectangle
- Double Top
- Double Top
- Triple Bottom
- Triple Bottom
- Triple Top
- Triple Top
- All
- All
- Buy
- Sale
- All
- 1
- 2
- 3
- 4
- 5
Teratas Triple
was formed on 18.04 at 22:15:20 (UTC+0)
signal strength 2 of 5

Pola Teratas Triple telah terbentuk pada grafik EURUSD M15. Fitur-fitur pola: perbatasan memiliki sudut yang naik; batas bawah pola memiliki koordinat 1.1387/1.1391 dengan batas atas 1.1397/1.1397; proyeksi lebar adalah
Rangka waktu M5 dan M15 mungkin memiliki lebih dari titik entri yang keliru.
Open chart in a new window
Persegi Bearish
was formed on 18.04 at 21:51:06 (UTC+0)
signal strength 2 of 5

Menurut grafik dari M15, NZDCAD terbentuk Persegi Bearish. Jenis pola ini menunjukkan kelanjutan tren. Terdiri dari dua tingkat: resistance 0.8222 - 0.0000 dan support 0.8206 – 0.8206. Jika level resistance
Rangka waktu M5 dan M15 mungkin memiliki lebih dari titik entri yang keliru.
Open chart in a new window
Bawah Ganda
was formed on 18.04 at 21:45:06 (UTC+0)
signal strength 2 of 5

Pola Bawah Ganda telah terbentuk pada USDJPY M15; batas atas di 142.30; batas bawah di 142.14. Lebar pola sebesar 17 poin. Jika harga menembus batas atas 142.30, Perubahan dalam tren
Rangka waktu M5 dan M15 mungkin memiliki lebih dari titik entri yang keliru.
Open chart in a new window


