

Dolzarb patternlar

Прямоугольник
сформирован 15.04 в 06:49:58 (UTC+0)
сила сигнала 4 из 5
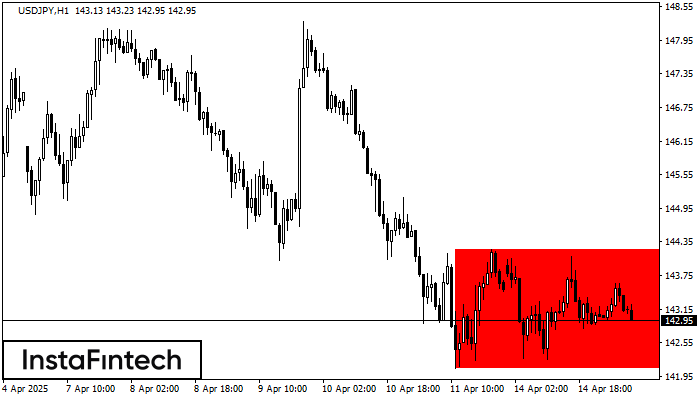
Сформирована фигура «Прямоугольник» на графике USDJPY H1. Тип фигуры: Продолжение тренда; Границы: Верхняя 144.21, Нижняя 142.08; Сигнал: позиция на продажу открывается после фиксации цены ниже границы прямоугольника 142.08.
- Все
- Все
- Bearish Rectangle
- Bearish Symmetrical Triangle
- Bearish Symmetrical Triangle
- Bullish Rectangle
- Double Top
- Double Top
- Triple Bottom
- Triple Bottom
- Triple Top
- Triple Top
- Все
- Все
- Покупка
- Продажа
- Все
- 1
- 2
- 3
- 4
- 5
Triple Top
сформирован 28.04 в 13:20:18 (UTC+0)
сила сигнала 1 из 5
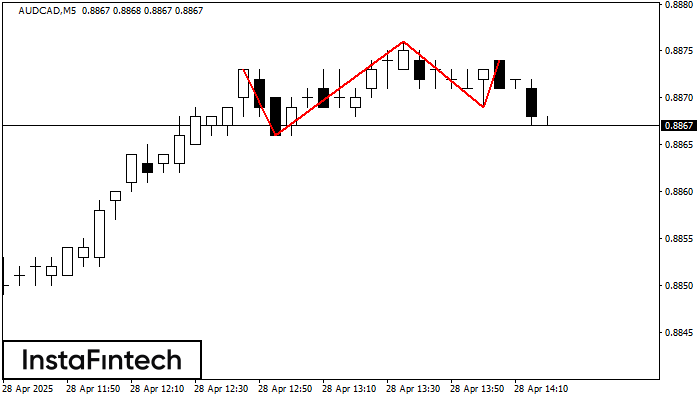
The Triple Top pattern has formed on the chart of the AUDCAD M5. Features of the pattern: borders have an ascending angle; the lower line of the pattern
The M5 and M15 time frames may have more false entry points.
Открыть график инструмента в новом окне
Double Bottom
сформирован 28.04 в 12:55:24 (UTC+0)
сила сигнала 1 из 5
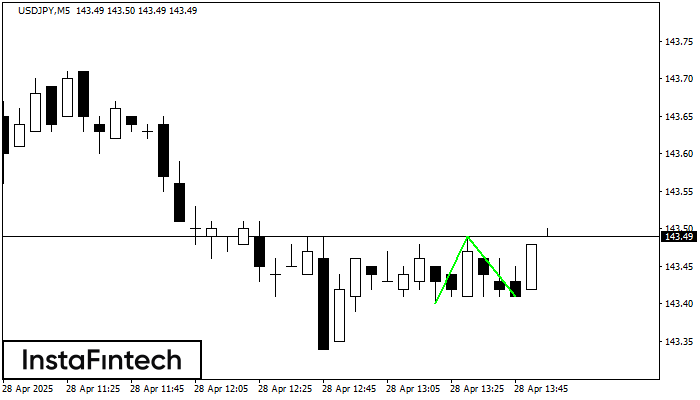
The Double Bottom pattern has been formed on USDJPY M5. Characteristics: the support level 143.40; the resistance level 143.49; the width of the pattern 9 points. If the resistance level
The M5 and M15 time frames may have more false entry points.
Открыть график инструмента в новом окне
Triple Bottom
сформирован 28.04 в 12:45:12 (UTC+0)
сила сигнала 2 из 5
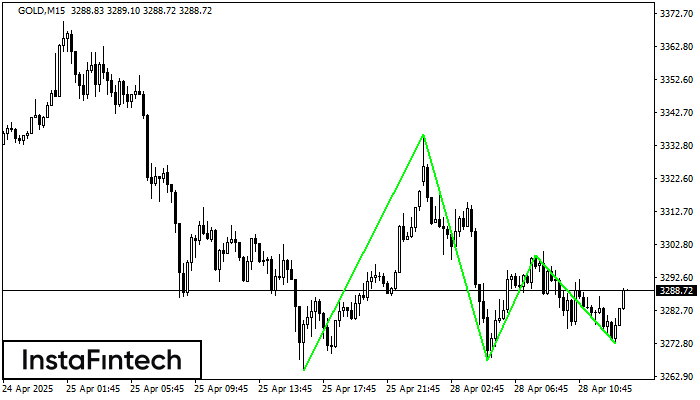
The Triple Bottom pattern has formed on the chart of the GOLD M15 trading instrument. The pattern signals a change in the trend from downwards to upwards in the case
The M5 and M15 time frames may have more false entry points.
Открыть график инструмента в новом окне


