

Dolzarb patternlar

Тройная вершина
сформирован 28.04 в 13:20:18 (UTC+0)
сила сигнала 1 из 5
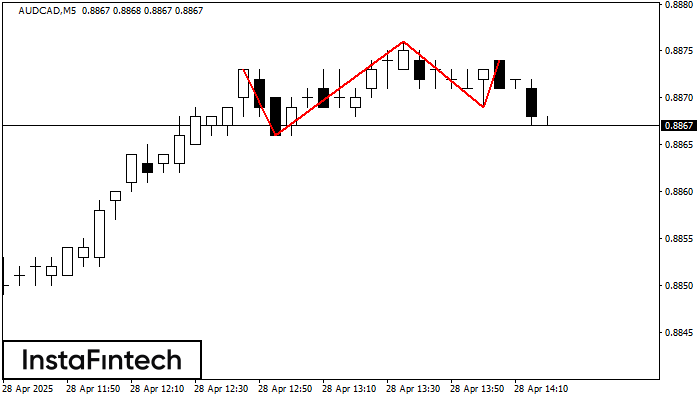
На графике AUDCAD M5 образовалась фигура «Тройная вершина», которая сигнализирует об изменении тенденции. Возможный сценарий: После формирования третьей вершины котировка постарается пробить нижнюю границу 0.8869, где трейдеру и стоило бы открывать торговую позицию на продажу. Тейк Профит - это и есть проекция ширины фигуры, которая составляет 7 пунктов.
Таймфреймы М5 и М15 могут иметь больше ложных точек входа.
Shuningdek ko'ring
- Все
- Все
- Bearish Rectangle
- Bearish Symmetrical Triangle
- Bearish Symmetrical Triangle
- Bullish Rectangle
- Double Top
- Double Top
- Triple Bottom
- Triple Bottom
- Triple Top
- Triple Top
- Все
- Все
- Покупка
- Продажа
- Все
- 1
- 2
- 3
- 4
- 5
Double Top
was formed on 09.05 at 08:30:08 (UTC+0)
signal strength 1 of 5
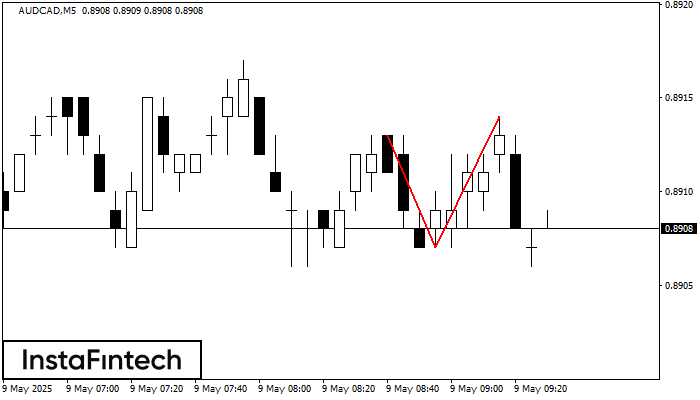
The Double Top pattern has been formed on AUDCAD M5. It signals that the trend has been changed from upwards to downwards. Probably, if the base of the pattern 0.8907
The M5 and M15 time frames may have more false entry points.
Open chart in a new window
Inverse Head and Shoulder
was formed on 09.05 at 08:30:02 (UTC+0)
signal strength 3 of 5
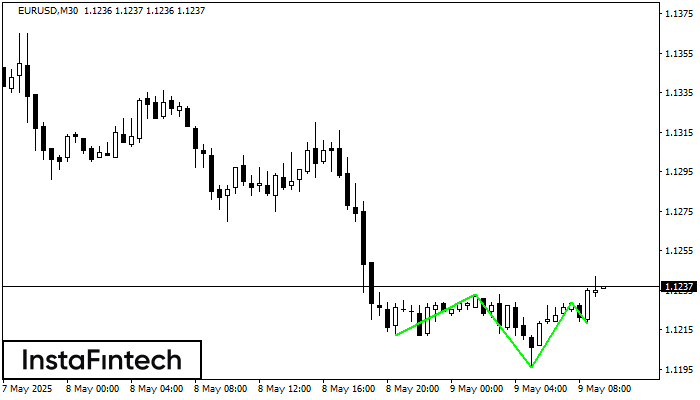
According to M30, EURUSD is shaping the technical pattern – the Inverse Head and Shoulder. In case the Neckline 1.1233/1.1229 is broken out, the instrument is likely to move toward
Open chart in a new window
Inverse Head and Shoulder
was formed on 09.05 at 08:29:53 (UTC+0)
signal strength 3 of 5
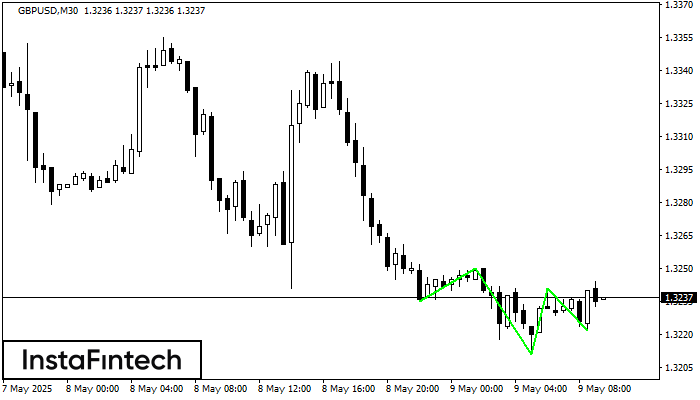
According to the chart of M30, GBPUSD produced the pattern termed the Inverse Head and Shoulder. The Head is fixed at 1.3211 while the median line of the Neck
Open chart in a new window


