

Dolzarb patternlar

Тройное дно
сформирован 04.04 в 11:25:26 (UTC+0)
сила сигнала 1 из 5
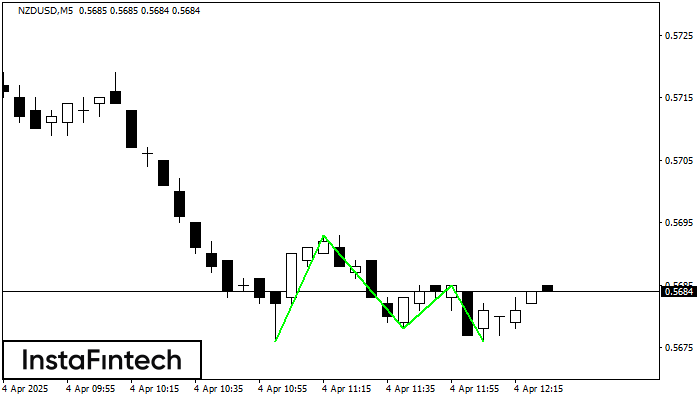
По торговому инструменту NZDUSD на M5 была сформирована графическая фигура «Тройное дно» с характеристиками: Уровень сопротивления 0.5685; Уровень поддержки 0.5676; Ширина 9 пунктов. В случае пробоя уровня сопротивления 0.5693 котировка, скорее всего, продолжит восходящее движение как минимум на 15 пунктов.
Таймфреймы М5 и М15 могут иметь больше ложных точек входа.
- Все
- Все
- Bearish Rectangle
- Bearish Symmetrical Triangle
- Bearish Symmetrical Triangle
- Bullish Rectangle
- Double Top
- Double Top
- Triple Bottom
- Triple Bottom
- Triple Top
- Triple Top
- Все
- Все
- Покупка
- Продажа
- Все
- 1
- 2
- 3
- 4
- 5
Bearish Rectangle
сформирован 27.04 в 06:31:28 (UTC+0)
сила сигнала 1 из 5

According to the chart of M5, #Bitcoin formed the Bearish Rectangle. The pattern indicates a trend continuation. The upper border is 94251.10, the lower border is 94078.08. The signal means
The M5 and M15 time frames may have more false entry points.
Открыть график инструмента в новом окне
Triple Bottom
сформирован 27.04 в 06:11:24 (UTC+0)
сила сигнала 1 из 5

The Triple Bottom pattern has formed on the chart of #Bitcoin M5. Features of the pattern: The lower line of the pattern has coordinates 94416.04 with the upper limit 94416.04/94251.10
The M5 and M15 time frames may have more false entry points.
Открыть график инструмента в новом окне
Triple Top
сформирован 26.04 в 20:16:22 (UTC+0)
сила сигнала 1 из 5

On the chart of the #Bitcoin M5 trading instrument, the Triple Top pattern that signals a trend change has formed. It is possible that after formation of the third peak
The M5 and M15 time frames may have more false entry points.
Открыть график инструмента в новом окне


