

Dolzarb patternlar

Прямоугольник
сформирован 27.04 в 06:31:28 (UTC+0)
сила сигнала 1 из 5

Сформирована фигура «Прямоугольник» на графике #Bitcoin M5. Тип фигуры: Продолжение тренда; Границы: Верхняя 94251.10, Нижняя 94078.08; Сигнал: позиция на продажу открывается после фиксации цены ниже границы прямоугольника 94078.08.
Таймфреймы М5 и М15 могут иметь больше ложных точек входа.
Shuningdek ko'ring
- Все
- Все
- Bearish Rectangle
- Bearish Symmetrical Triangle
- Bearish Symmetrical Triangle
- Bullish Rectangle
- Double Top
- Double Top
- Triple Bottom
- Triple Bottom
- Triple Top
- Triple Top
- Все
- Все
- Покупка
- Продажа
- Все
- 1
- 2
- 3
- 4
- 5
Bearish Rectangle
сформирован 13.05 в 18:18:44 (UTC+0)
сила сигнала 1 из 5
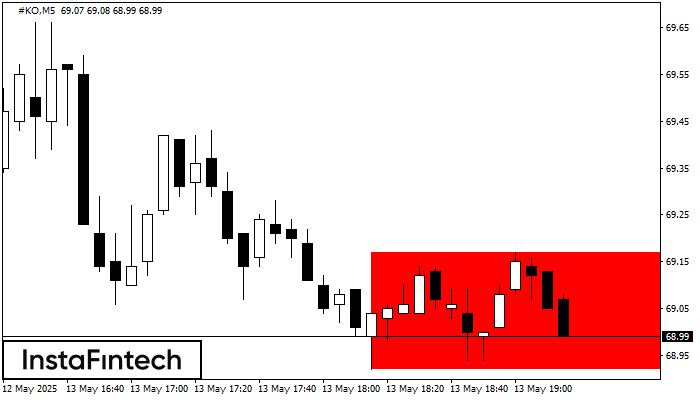
According to the chart of M5, #KO formed the Bearish Rectangle which is a pattern of a trend continuation. The pattern is contained within the following borders: lower border 68.92
The M5 and M15 time frames may have more false entry points.
Открыть график инструмента в новом окне
Double Bottom
сформирован 13.05 в 18:05:05 (UTC+0)
сила сигнала 1 из 5
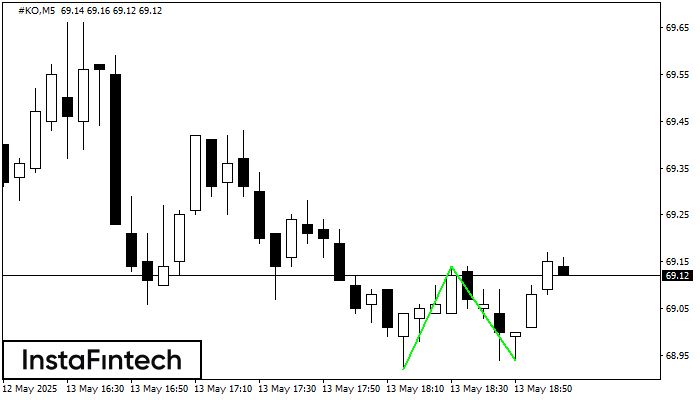
The Double Bottom pattern has been formed on #KO M5; the upper boundary is 69.14; the lower boundary is 68.94. The width of the pattern is 22 points. In case
The M5 and M15 time frames may have more false entry points.
Открыть график инструмента в новом окне
Double Top
сформирован 13.05 в 17:49:45 (UTC+0)
сила сигнала 1 из 5
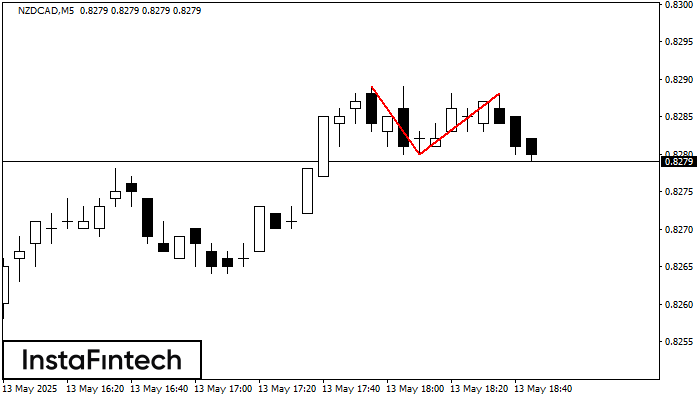
On the chart of NZDCAD M5 the Double Top reversal pattern has been formed. Characteristics: the upper boundary 0.8288; the lower boundary 0.8280; the width of the pattern 8 points
The M5 and M15 time frames may have more false entry points.
Открыть график инструмента в новом окне


