

Dolzarb patternlar

Прямоугольник
сформирован 01.04 в 07:00:39 (UTC+0)
сила сигнала 4 из 5
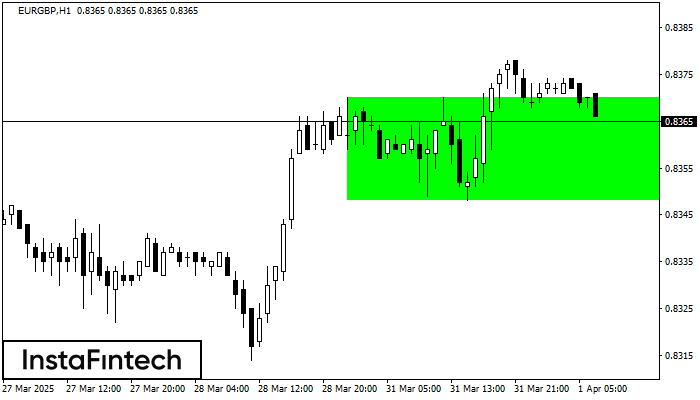
Сформирована фигура «Прямоугольник» на графике EURGBP H1. Тип фигуры: Продолжение тренда; Границы: Верхняя 0.8370, Нижняя 0.8348; Сигнал: позицию на покупку следует открывать выше верхней границы прямоугольника 0.8370.
- Все
- Все
- Bearish Rectangle
- Bearish Symmetrical Triangle
- Bearish Symmetrical Triangle
- Bullish Rectangle
- Double Top
- Double Top
- Triple Bottom
- Triple Bottom
- Triple Top
- Triple Top
- Все
- Все
- Покупка
- Продажа
- Все
- 1
- 2
- 3
- 4
- 5
Double Bottom
сформирован 28.04 в 12:20:24 (UTC+0)
сила сигнала 1 из 5
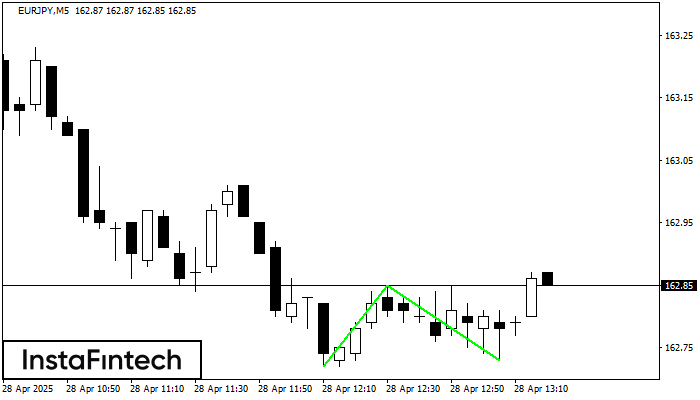
The Double Bottom pattern has been formed on EURJPY M5. This formation signals a reversal of the trend from downwards to upwards. The signal is that a buy trade should
The M5 and M15 time frames may have more false entry points.
Открыть график инструмента в новом окне
Double Bottom
сформирован 28.04 в 12:05:31 (UTC+0)
сила сигнала 1 из 5
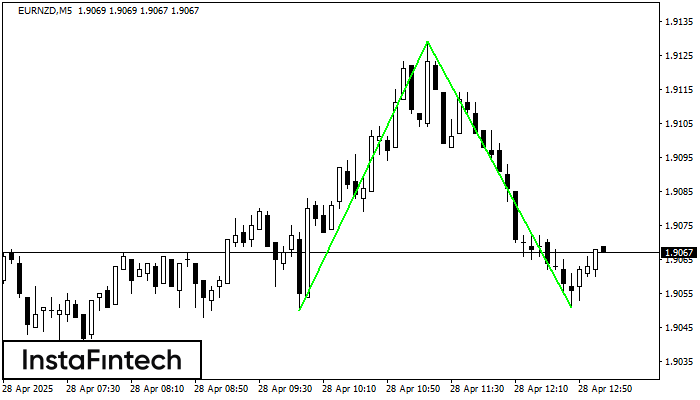
The Double Bottom pattern has been formed on EURNZD M5. This formation signals a reversal of the trend from downwards to upwards. The signal is that a buy trade should
The M5 and M15 time frames may have more false entry points.
Открыть график инструмента в новом окне
Bullish Rectangle
сформирован 28.04 в 10:27:29 (UTC+0)
сила сигнала 1 из 5
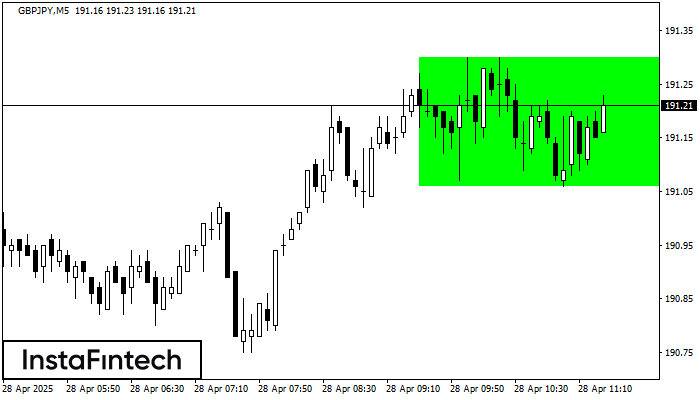
According to the chart of M5, GBPJPY formed the Bullish Rectangle. This type of a pattern indicates a trend continuation. It consists of two levels: resistance 191.30 and support 191.06
The M5 and M15 time frames may have more false entry points.
Открыть график инструмента в новом окне


