

Dolzarb patternlar

Двойное дно
сформирован 28.04 в 12:05:31 (UTC+0)
сила сигнала 1 из 5
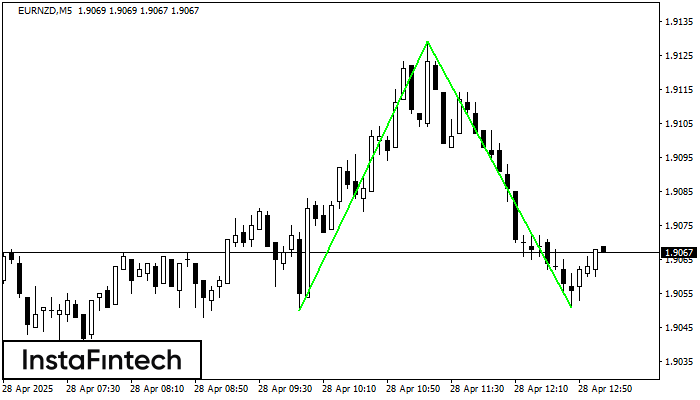
Сформирована фигура «Двойное дно» на графике EURNZD M5. Данное формирование сигнализирует об изменении тенденции с нисходящего на восходящее движение. Сигнал: Торговую позицию на покупку следует открывать после пробоя верхней границы фигуры 1.9129, где перспектива будущего хода будет являться шириной текущей фигуры - 79 пунктов.
Таймфреймы М5 и М15 могут иметь больше ложных точек входа.
- Все
- Все
- Bearish Rectangle
- Bearish Symmetrical Triangle
- Bearish Symmetrical Triangle
- Bullish Rectangle
- Double Top
- Double Top
- Triple Bottom
- Triple Bottom
- Triple Top
- Triple Top
- Все
- Все
- Покупка
- Продажа
- Все
- 1
- 2
- 3
- 4
- 5
Bearish Symmetrical Triangle
was formed on 14.05 at 17:47:54 (UTC+0)
signal strength 1 of 5
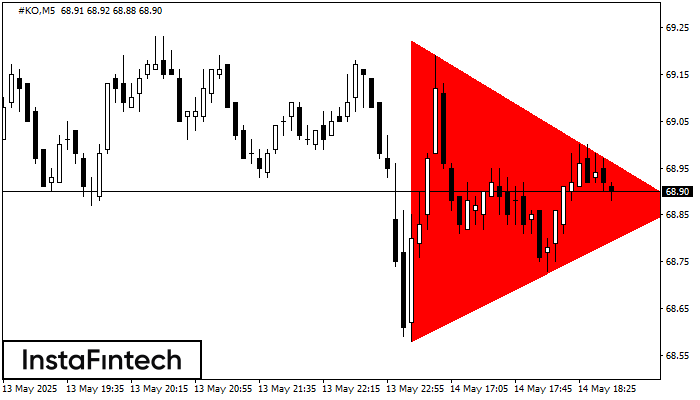
According to the chart of M5, #KO formed the Bearish Symmetrical Triangle pattern. Description: The lower border is 68.58/68.87 and upper border is 69.22/68.87. The pattern width is measured
The M5 and M15 time frames may have more false entry points.
Open chart in a new window
Double Bottom
was formed on 14.05 at 17:35:13 (UTC+0)
signal strength 1 of 5
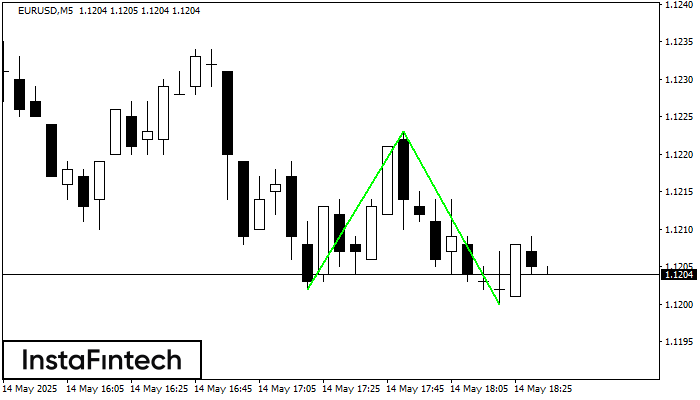
The Double Bottom pattern has been formed on EURUSD M5. Characteristics: the support level 1.1202; the resistance level 1.1223; the width of the pattern 21 points. If the resistance level
The M5 and M15 time frames may have more false entry points.
Open chart in a new window
Double Bottom
was formed on 14.05 at 17:30:22 (UTC+0)
signal strength 1 of 5
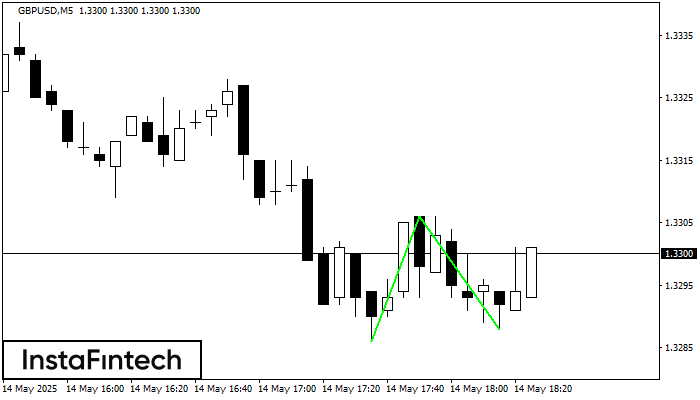
The Double Bottom pattern has been formed on GBPUSD M5. Characteristics: the support level 1.3286; the resistance level 1.3306; the width of the pattern 20 points. If the resistance level
The M5 and M15 time frames may have more false entry points.
Open chart in a new window


