

Dolzarb patternlar

Прямоугольник
сформирован 21.03 в 21:46:26 (UTC+0)
сила сигнала 1 из 5

По торговому инструменту USDCAD на M5 сформировалась фигура продолжения тренда - «Прямоугольник». Фигура имеет границы: Нижняя 1.4338; Верхняя 1.4351. В случае пробоя нижней границы вероятно дальнейшее движение в сторону тренда.
Таймфреймы М5 и М15 могут иметь больше ложных точек входа.
Shuningdek ko'ring
- Все
- Все
- Bearish Rectangle
- Bearish Symmetrical Triangle
- Bearish Symmetrical Triangle
- Bullish Rectangle
- Double Top
- Double Top
- Triple Bottom
- Triple Bottom
- Triple Top
- Triple Top
- Все
- Все
- Покупка
- Продажа
- Все
- 1
- 2
- 3
- 4
- 5
Double Bottom
сформирован 27.03 в 09:15:39 (UTC+0)
сила сигнала 1 из 5
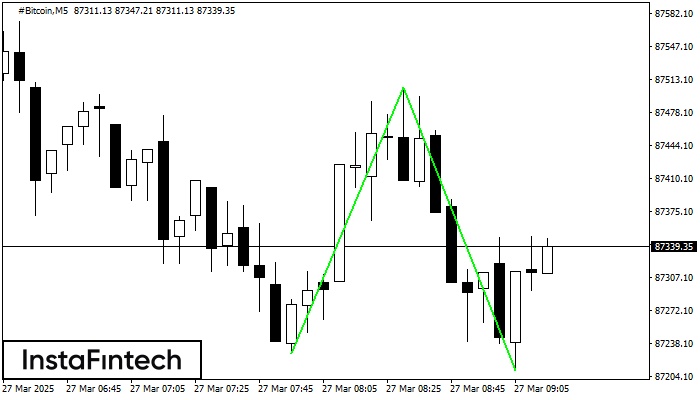
The Double Bottom pattern has been formed on #Bitcoin M5; the upper boundary is 87504.98; the lower boundary is 87210.25. The width of the pattern is 27754 points. In case
The M5 and M15 time frames may have more false entry points.
Открыть график инструмента в новом окне
Inverse Head and Shoulder
сформирован 27.03 в 09:00:09 (UTC+0)
сила сигнала 3 из 5
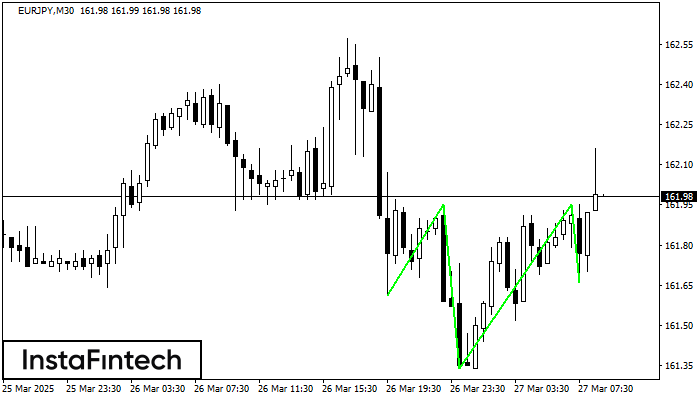
According to M30, EURJPY is shaping the technical pattern – the Inverse Head and Shoulder. In case the Neckline 161.95/161.95 is broken out, the instrument is likely to move toward
Открыть график инструмента в новом окне
Bullish Rectangle
сформирован 27.03 в 08:06:38 (UTC+0)
сила сигнала 1 из 5
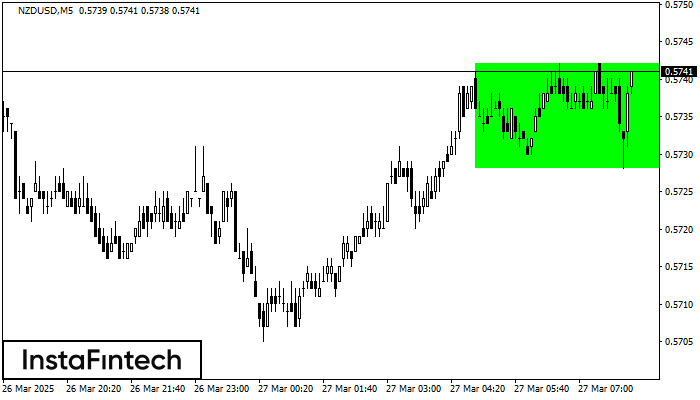
According to the chart of M5, NZDUSD formed the Bullish Rectangle which is a pattern of a trend continuation. The pattern is contained within the following borders: the lower border
The M5 and M15 time frames may have more false entry points.
Открыть график инструмента в новом окне


