

Dolzarb patternlar

Двойное дно
сформирован 27.03 в 09:15:39 (UTC+0)
сила сигнала 1 из 5
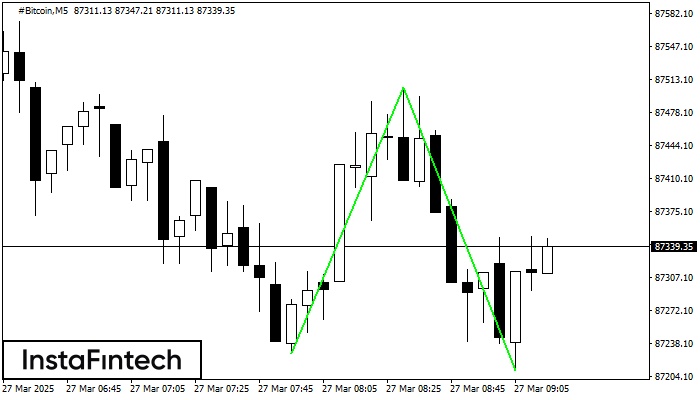
Сформирована фигура «Двойное дно» на графике #Bitcoin M5. Верхняя граница 87504.98; Нижняя граница 87210.25; Ширина фигуры 27754 пунктов. В случае пробоя верхней границы 87504.98 можно будет прогнозировать изменение тенденции, где ширина фигуры и будет являться расстоянием предположительного Тейк Профита.
Таймфреймы М5 и М15 могут иметь больше ложных точек входа.
- Все
- Все
- Bearish Rectangle
- Bearish Symmetrical Triangle
- Bearish Symmetrical Triangle
- Bullish Rectangle
- Double Top
- Double Top
- Triple Bottom
- Triple Bottom
- Triple Top
- Triple Top
- Все
- Все
- Покупка
- Продажа
- Все
- 1
- 2
- 3
- 4
- 5
Head and Shoulders
was formed on 09.06 at 15:40:28 (UTC+0)
signal strength 1 of 5
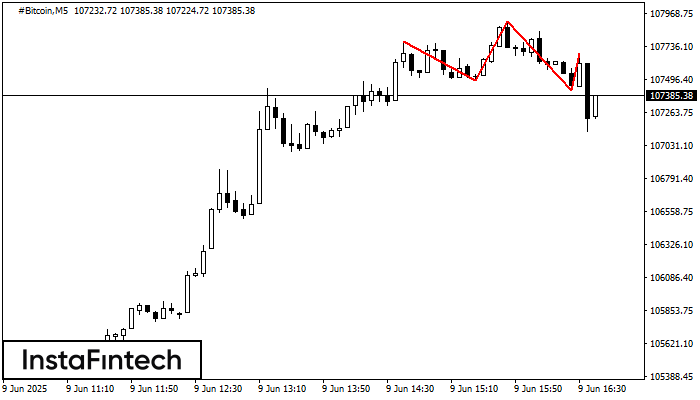
The #Bitcoin M5 formed the Head and Shoulders pattern with the following features: The Head’s top is at 107912.77, the Neckline and the upward angle are at 107491.49/107422.45. The formation
The M5 and M15 time frames may have more false entry points.
Open chart in a new window
Inverse Head and Shoulder
was formed on 09.06 at 15:30:31 (UTC+0)
signal strength 2 of 5

According to M15, #INTC is shaping the technical pattern – the Inverse Head and Shoulder. In case the Neckline 20.54/20.43 is broken out, the instrument is likely to move toward
The M5 and M15 time frames may have more false entry points.
Open chart in a new window
Bullish Flag
was formed on 09.06 at 15:30:14 (UTC+0)
signal strength 1 of 5

The Bullish Flag pattern has been formed on the chart #AMZN M5 which signals that the upward trend will continue. Signals: а break of the peak at 213.88 may push
The M5 and M15 time frames may have more false entry points.
Open chart in a new window


