

รูปแบบกราฟ

รูปแบบกราฟนั้นเป็น รูปจำลองทางกราฟฟิกที่ถูกสร้างขึ้นมาในชาร์ตจากราคา อ้างอิงตามหนึ่งในการวิเคราะห์ทางเทคนิค ที่ตั้งสมมติฐานมาว่า ประวัติศาสตร์ (การเคลื่อนไหวของราคา) มักจะเกิดขึ้นซ้ำรอยเดิม นั้นหมายความว่า การเคลื่อนไหวของราคาก็หมือนกับ สถานการณ์หนึ่งที่จะสามารถทำการคาดการณ์ไปยังทิศทางในอนาคต ตามเหตุการณ์ที่น่าจะมีความเป็นไปได้สูง
รูปแบบกราฟที่สำคัญจากทาง InstaTrade นั้นจะเป็นการบริการที่มีการใช้อย่างง่ายดาย ซึ่งจะช่วยให้คุณสามารถทราบถึงการเปลี่ยนแปลงล่าสุด ในตลาดได้ และสามารถรับมือกับข้อมูลจากทางตลาดได้ทันท่วงที ในการบริการของพวกเรานั้น คุณจะพบกับรูปแบบกราฟล่าสุดและมีความสำคัญมากที่สุดในทุกๆคู่สกุลเงิน และทุกๆขอบเขตเวลา
Inverse Head and Shoulder
was formed on 28.03 at 20:16:00 (UTC+0)
signal strength 1 of 5
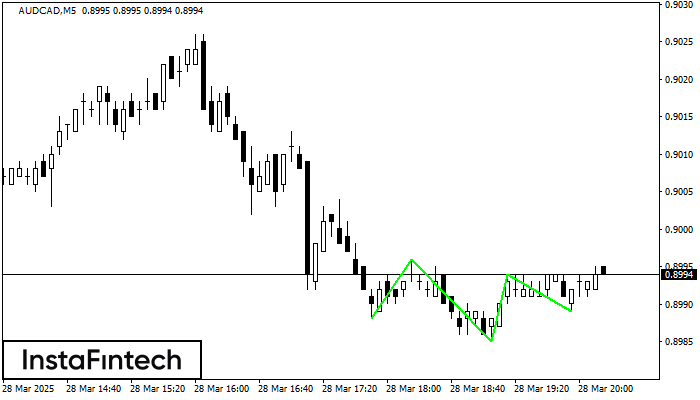
According to the chart of M5, AUDCAD produced the pattern termed the Inverse Head and Shoulder. The Head is fixed at 0.8985 while the median line of the Neck is set at 0.8996/0.8994. The formation of the Inverse Head and Shoulder Pattern clearly indicates a reversal of the downward trend. In means that in case the scenario comes true, the price of AUDCAD will go towards 0.9009.
The M5 and M15 time frames may have more false entry points.
- All
- All
- Bearish Rectangle
- Bearish Symmetrical Triangle
- Bearish Symmetrical Triangle
- Bullish Rectangle
- Double Top
- Double Top
- Triple Bottom
- Triple Bottom
- Triple Top
- Triple Top
- All
- All
- Buy
- Sale
- All
- 1
- 2
- 3
- 4
- 5
Bullish Rectangle
сформирован 14.04 в 13:01:10 (UTC+0)
сила сигнала 1 из 5
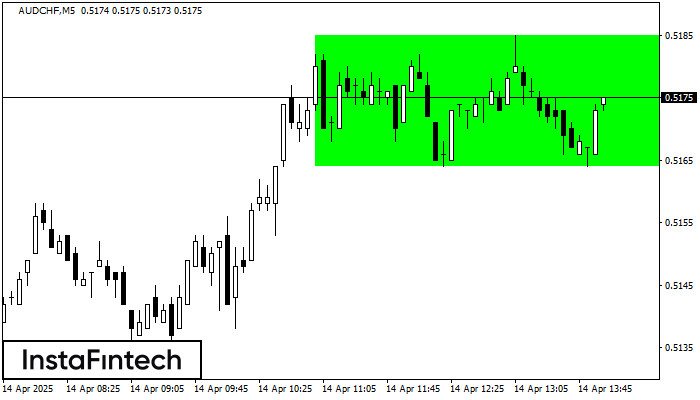
According to the chart of M5, AUDCHF formed the Bullish Rectangle. The pattern indicates a trend continuation. The upper border is 0.5185, the lower border is 0.5164. The signal means
The M5 and M15 time frames may have more false entry points.
Открыть график инструмента в новом окне
Double Bottom
сформирован 14.04 в 13:00:23 (UTC+0)
сила сигнала 4 из 5
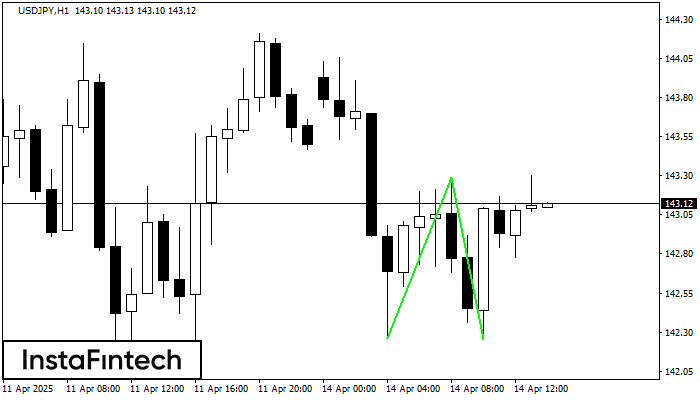
The Double Bottom pattern has been formed on USDJPY H1. Characteristics: the support level 142.26; the resistance level 143.29; the width of the pattern 103 points. If the resistance level
Открыть график инструмента в новом окне
Bullish Symmetrical Triangle
сформирован 14.04 в 12:56:06 (UTC+0)
сила сигнала 1 из 5

According to the chart of M5, NZDJPY formed the Bullish Symmetrical Triangle pattern. Description: This is the pattern of a trend continuation. 84.17 and 83.88 are the coordinates
The M5 and M15 time frames may have more false entry points.
Открыть график инструмента в новом окне


