

Dolzarb patternlar

Прямоугольник
сформирован 14.04 в 13:01:10 (UTC+0)
сила сигнала 1 из 5
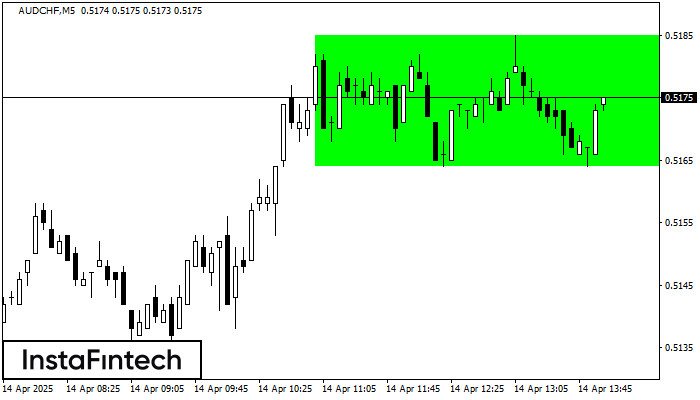
Сформирована фигура «Прямоугольник» на графике AUDCHF M5. Тип фигуры: Продолжение тренда; Границы: Верхняя 0.5185, Нижняя 0.5164; Сигнал: позицию на покупку следует открывать выше верхней границы прямоугольника 0.5185.
Таймфреймы М5 и М15 могут иметь больше ложных точек входа.
Shuningdek ko'ring
- Все
- Все
- Bearish Rectangle
- Bearish Symmetrical Triangle
- Bearish Symmetrical Triangle
- Bullish Rectangle
- Double Top
- Double Top
- Triple Bottom
- Triple Bottom
- Triple Top
- Triple Top
- Все
- Все
- Покупка
- Продажа
- Все
- 1
- 2
- 3
- 4
- 5
Bearish Rectangle
сформирован 28.04 в 20:16:55 (UTC+0)
сила сигнала 1 из 5
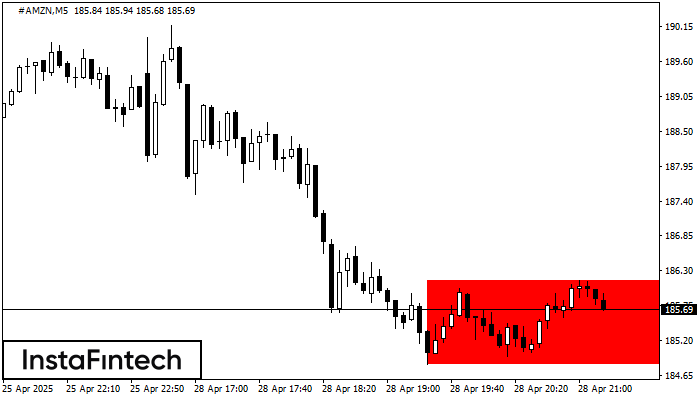
According to the chart of M5, #AMZN formed the Bearish Rectangle. The pattern indicates a trend continuation. The upper border is 186.15, the lower border is 184.83. The signal means
The M5 and M15 time frames may have more false entry points.
Открыть график инструмента в новом окне
Double Bottom
сформирован 28.04 в 20:15:27 (UTC+0)
сила сигнала 2 из 5
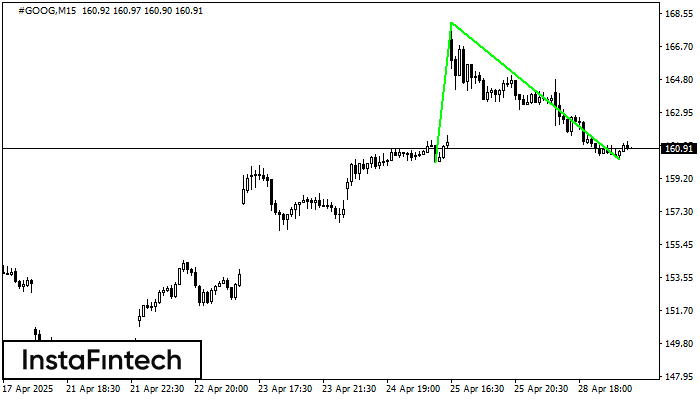
The Double Bottom pattern has been formed on #GOOG M15. Characteristics: the support level 160.09; the resistance level 168.07; the width of the pattern 798 points. If the resistance level
The M5 and M15 time frames may have more false entry points.
Открыть график инструмента в новом окне
Bearish Rectangle
сформирован 28.04 в 20:10:35 (UTC+0)
сила сигнала 1 из 5
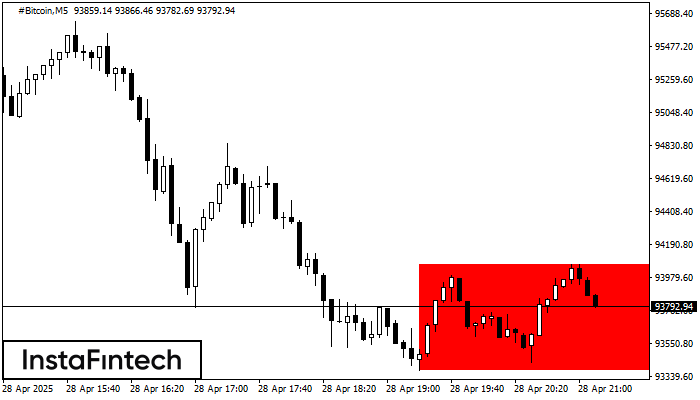
According to the chart of M5, #Bitcoin formed the Bearish Rectangle which is a pattern of a trend continuation. The pattern is contained within the following borders: lower border 93376.97
The M5 and M15 time frames may have more false entry points.
Открыть график инструмента в новом окне


