

Pola sebenarnya

Double Top
was formed on 27.03 at 11:05:29 (UTC+0)
signal strength 1 of 5
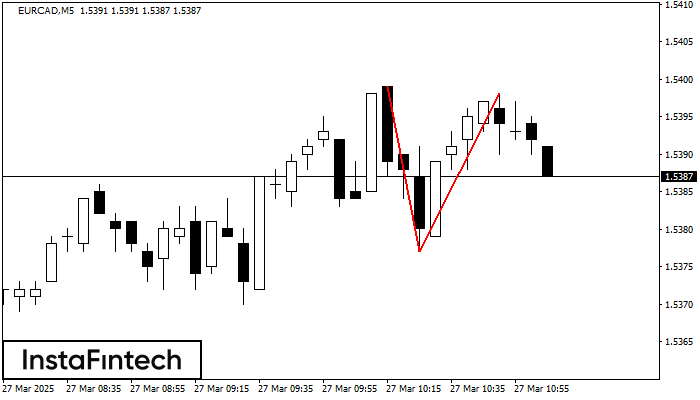
On the chart of EURCAD M5 the Double Top reversal pattern has been formed. Characteristics: the upper boundary 1.5398; the lower boundary 1.5377; the width of the pattern 21 points. The signal: a break of the lower boundary will cause continuation of the downward trend targeting the 1.5362 level.
The M5 and M15 time frames may have more false entry points.
- All
- All
- Bearish Rectangle
- Bearish Symmetrical Triangle
- Bearish Symmetrical Triangle
- Bullish Rectangle
- Double Top
- Double Top
- Triple Bottom
- Triple Bottom
- Triple Top
- Triple Top
- All
- All
- Buy
- Sale
- All
- 1
- 2
- 3
- 4
- 5
Bawah Ganda
was formed on 16.04 at 00:35:20 (UTC+0)
signal strength 1 of 5

Pola Bawah Ganda telah terbentuk pada #Bitcoin M5; batas atas di 84198.05; batas bawah di 83772.49. Lebar pola sebesar 43677 poin. Jika harga menembus batas atas 84198.05, Perubahan dalam tren
Rangka waktu M5 dan M15 mungkin memiliki lebih dari titik entri yang keliru.
Open chart in a new window
Segitiga Simetris Bullish
was formed on 16.04 at 00:26:32 (UTC+0)
signal strength 1 of 5

Menurut Grafik dari M5, USDCHF dibentuk pola Segitiga Simetris Bullish. Batas yang lebih rendah dari pola menyentuh kordinat 0.8198/0.8221 dimana batas atas berada sepanjang 0.8238/0.8221. Jika pola Segitiga Simetris Bullish
Rangka waktu M5 dan M15 mungkin memiliki lebih dari titik entri yang keliru.
Open chart in a new window
Bendera Bearish
was formed on 16.04 at 00:23:57 (UTC+0)
signal strength 1 of 5

Pola Bendera Bearish telah terbentuk di grafik AUDCAD M5. Oleh karena itu, tren menurun kemungkinan akan berlanjut dalam waktu dekat. Segera setelah harga menembus ke bawah titik trendah di 0.8835
Rangka waktu M5 dan M15 mungkin memiliki lebih dari titik entri yang keliru.
Open chart in a new window

