

Pola sebenarnya

Bearish Flag
was formed on 16.04 at 00:23:57 (UTC+0)
signal strength 1 of 5

The Bearish Flag pattern has been formed on the chart AUDCAD M5. Therefore, the downwards trend is likely to continue in the nearest term. As soon as the price breaks below the low at 0.8835, traders should enter the market.
The M5 and M15 time frames may have more false entry points.
- All
- All
- Bearish Rectangle
- Bearish Symmetrical Triangle
- Bearish Symmetrical Triangle
- Bullish Rectangle
- Double Top
- Double Top
- Triple Bottom
- Triple Bottom
- Triple Top
- Triple Top
- All
- All
- Buy
- Sale
- All
- 1
- 2
- 3
- 4
- 5
Bullish pennant
was formed on 22.04 at 16:10:26 (UTC+0)
signal strength 1 of 5
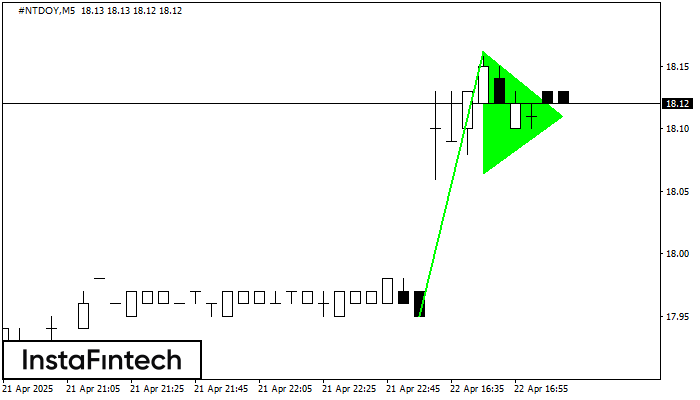
The Bullish pennant signal – Trading instrument #NTDOY M5, continuation pattern. Forecast: it is possible to set up a buy position above the pattern’s high of 18.16, with the prospect
The M5 and M15 time frames may have more false entry points.
Open chart in a new window
Bullish pennant
was formed on 22.04 at 16:10:18 (UTC+0)
signal strength 1 of 5
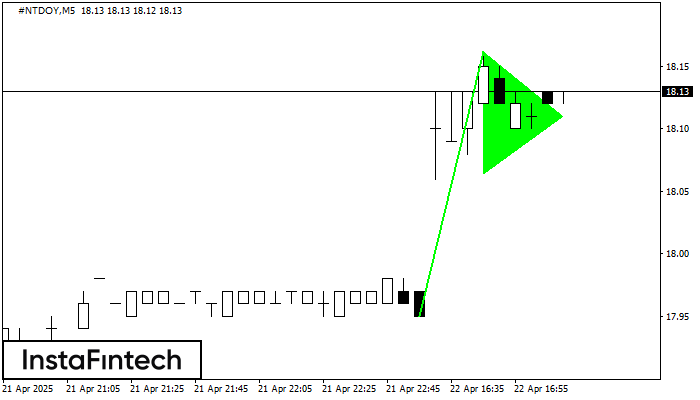
The Bullish pennant signal – Trading instrument #NTDOY M5, continuation pattern. Forecast: it is possible to set up a buy position above the pattern’s high of 18.16, with the prospect
The M5 and M15 time frames may have more false entry points.
Open chart in a new window
Bullish pennant
was formed on 22.04 at 16:05:23 (UTC+0)
signal strength 1 of 5
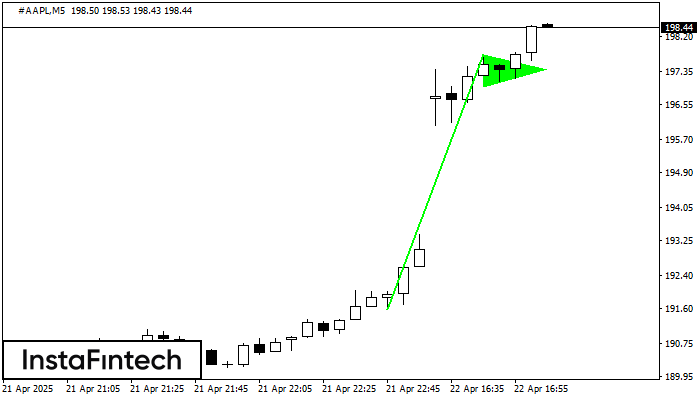
The Bullish pennant signal – Trading instrument #AAPL M5, continuation pattern. Forecast: it is possible to set up a buy position above the pattern’s high of 197.78, with the prospect
The M5 and M15 time frames may have more false entry points.
Open chart in a new window


