

Actual patterns

Patterns are graphical models which are formed in the chart by the price. According to one of the technical analysis postulates, history (price movement) repeats itself. It means that the price movements are often similar in the same situations which makes it possible to predict the further development of the situation with a high probability.
Relevant patterns by InstaTrade is an easy-to-use service which allows you to be aware of latest changes in the market and react to clues from the market in time. In our service you will always find the latest and most relevant patterns on any pair and any timeframe.
Bearish Symmetrical Triangle
was formed on 24.03 at 03:05:44 (UTC+0)
signal strength 1 of 5
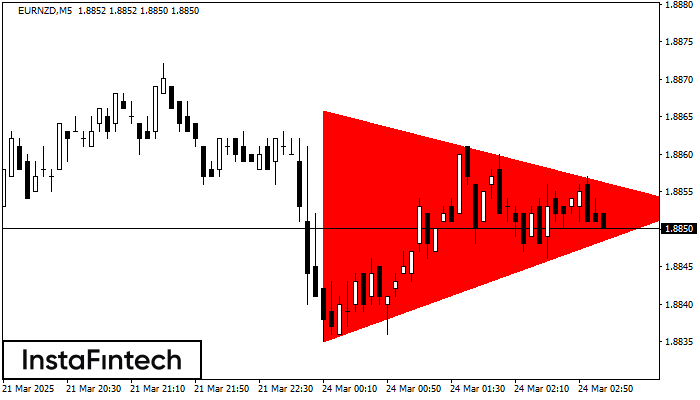
According to the chart of M5, EURNZD formed the Bearish Symmetrical Triangle pattern. Description: The lower border is 1.8835/1.8853 and upper border is 1.8866/1.8853. The pattern width is measured on the chart at -31 pips. The formation of the Bearish Symmetrical Triangle pattern evidently signals a continuation of the downward trend. In other words, if the scenario comes true and EURNZD breaches the lower border, the price could continue its move toward 1.8838.
The M5 and M15 time frames may have more false entry points.
- All
- All
- Bearish Rectangle
- Bearish Symmetrical Triangle
- Bearish Symmetrical Triangle
- Bullish Rectangle
- Double Top
- Double Top
- Triple Bottom
- Triple Bottom
- Triple Top
- Triple Top
- All
- All
- Buy
- Sale
- All
- 1
- 2
- 3
- 4
- 5
Bawah Ganda
was formed on 16.04 at 00:35:20 (UTC+0)
signal strength 1 of 5

Pola Bawah Ganda telah terbentuk pada #Bitcoin M5; batas atas di 84198.05; batas bawah di 83772.49. Lebar pola sebesar 43677 poin. Jika harga menembus batas atas 84198.05, Perubahan dalam tren
Rangka waktu M5 dan M15 mungkin memiliki lebih dari titik entri yang keliru.
Open chart in a new window
Segitiga Simetris Bullish
was formed on 16.04 at 00:26:32 (UTC+0)
signal strength 1 of 5

Menurut Grafik dari M5, USDCHF dibentuk pola Segitiga Simetris Bullish. Batas yang lebih rendah dari pola menyentuh kordinat 0.8198/0.8221 dimana batas atas berada sepanjang 0.8238/0.8221. Jika pola Segitiga Simetris Bullish
Rangka waktu M5 dan M15 mungkin memiliki lebih dari titik entri yang keliru.
Open chart in a new window
Bendera Bearish
was formed on 16.04 at 00:23:57 (UTC+0)
signal strength 1 of 5

Pola Bendera Bearish telah terbentuk di grafik AUDCAD M5. Oleh karena itu, tren menurun kemungkinan akan berlanjut dalam waktu dekat. Segera setelah harga menembus ke bawah titik trendah di 0.8835
Rangka waktu M5 dan M15 mungkin memiliki lebih dari titik entri yang keliru.
Open chart in a new window


