

Các mẫu thực tế

Các mẫu là các mô hình đồ họa được hình thành trong biểu đồ theo giá. Theo một trong những định đề phân tích kỹ thuật, lịch sử (chuyển động giá) thường tự lặp lại. Có nghĩa là biến động giá thường giống nhau trong các tình huống giống nhau, do đó có thể dự đoán chuyển động tiếp theo của tình huống với xác suất cao.
Các mẫu hữu quan của InstaTrade là một dịch vụ dễ sử dụng cho phép bạn nhận biết được những thay đổi mới nhất trên thị trường và phản ứng kịp thời với các dấu hiệu từ thị trường. Trong dịch vụ của chúng tôi, bạn sẽ luôn tìm thấy các mẫu mới nhất và phù hợp nhất trên bất kỳ cặp nào và bất kỳ khung thời gian nào.
Bullish Symmetrical Triangle
was formed on 25.04 at 10:00:07 (UTC+0)
signal strength 1 of 5
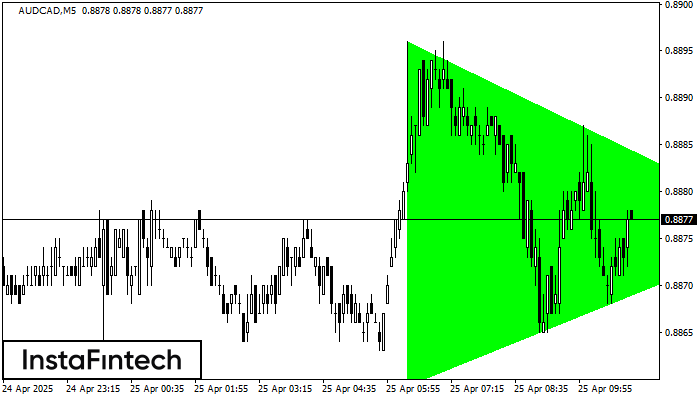
According to the chart of M5, AUDCAD formed the Bullish Symmetrical Triangle pattern, which signals the trend will continue. Description. The upper border of the pattern touches the coordinates 0.8896/0.8876 whereas the lower border goes across 0.8859/0.8876. The pattern width is measured on the chart at 37 pips. If the Bullish Symmetrical Triangle pattern is in progress during the upward trend, this indicates the current trend will go on. In case 0.8876 is broken, the price could continue its move toward 0.8891.
The M5 and M15 time frames may have more false entry points.
- All
- All
- Bearish Rectangle
- Bearish Symmetrical Triangle
- Bearish Symmetrical Triangle
- Bullish Rectangle
- Double Top
- Double Top
- Triple Bottom
- Triple Bottom
- Triple Top
- Triple Top
- All
- All
- Buy
- Sale
- All
- 1
- 2
- 3
- 4
- 5
Tam giác Cân Giảm
was formed on 13.05 at 21:54:58 (UTC+0)
signal strength 2 of 5
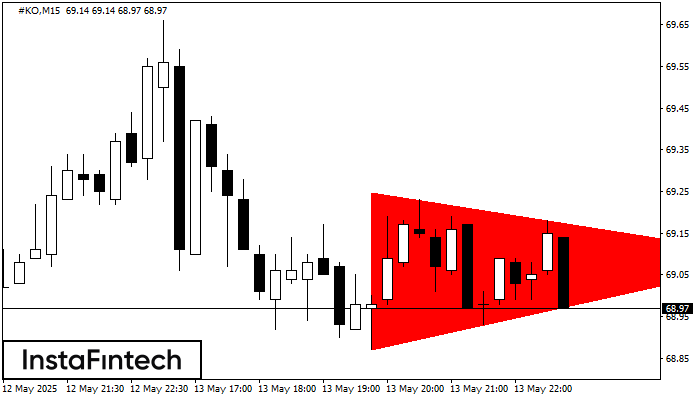
Theo biểu đồ của M15, #KO đã hình thành mô hình Tam giác Cân Giảm. Mô tả: Đường biên giới thấp hơn là 68.87/69.09 và đường biên giới
Khung thời gian M5 và M15 có thể có nhiều điểm vào lệnh sai hơn.
Open chart in a new window
Tam giác Cân Giảm
was formed on 13.05 at 21:53:19 (UTC+0)
signal strength 1 of 5
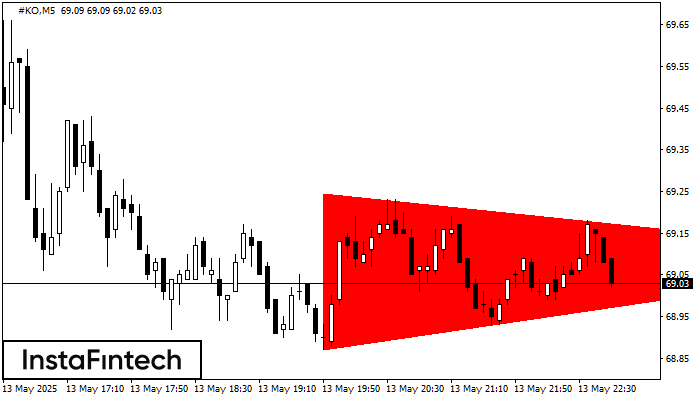
Theo biểu đồ của M5, #KO đã hình thành mô hình Tam giác Cân Giảm. Khuyến nghị giao dịch: Việc vi phạm biên giới thấp hơn 68.87 có khả năng
Khung thời gian M5 và M15 có thể có nhiều điểm vào lệnh sai hơn.
Open chart in a new window
Cờ hiệu tăng
was formed on 13.05 at 21:30:25 (UTC+0)
signal strength 4 of 5
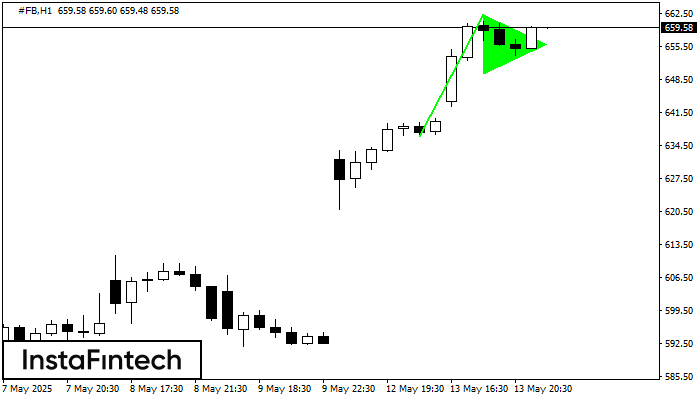
Tín hiệu Cờ hiệu tăng - Công cụ giao dịch #FB H1, mô hình tiếp tục. Dự đoán: có thể thiết lập vị trí mua trên
Open chart in a new window
