

Các mẫu thực tế

Các mẫu là các mô hình đồ họa được hình thành trong biểu đồ theo giá. Theo một trong những định đề phân tích kỹ thuật, lịch sử (chuyển động giá) thường tự lặp lại. Có nghĩa là biến động giá thường giống nhau trong các tình huống giống nhau, do đó có thể dự đoán chuyển động tiếp theo của tình huống với xác suất cao.
Các mẫu hữu quan của InstaTrade là một dịch vụ dễ sử dụng cho phép bạn nhận biết được những thay đổi mới nhất trên thị trường và phản ứng kịp thời với các dấu hiệu từ thị trường. Trong dịch vụ của chúng tôi, bạn sẽ luôn tìm thấy các mẫu mới nhất và phù hợp nhất trên bất kỳ cặp nào và bất kỳ khung thời gian nào.
Double Bottom
was formed on 14.04 at 10:00:17 (UTC+0)
signal strength 2 of 5

The Double Bottom pattern has been formed on USDJPY M15. Characteristics: the support level 142.26; the resistance level 143.29; the width of the pattern 103 points. If the resistance level is broken, a change in the trend can be predicted with the first target point lying at the distance of 104 points.
The M5 and M15 time frames may have more false entry points.
- All
- All
- Bearish Rectangle
- Bearish Symmetrical Triangle
- Bearish Symmetrical Triangle
- Bullish Rectangle
- Double Top
- Double Top
- Triple Bottom
- Triple Bottom
- Triple Top
- Triple Top
- All
- All
- Buy
- Sale
- All
- 1
- 2
- 3
- 4
- 5
Triângulo Simétrico de Alta
was formed on 28.05 at 16:02:01 (UTC+0)
signal strength 1 of 5
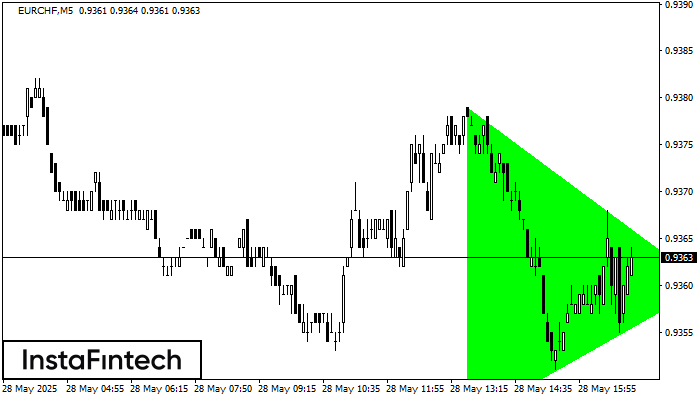
De acordo com o gráfico de M5, EURCHF formou o padrão de Triângulo Simétrico de Alta. O limite inferior do padrão toca as coordenadas 0.9346/0.9360 enquanto o limite superior cruza
Os intervalos M5 e M15 podem ter mais pontos de entrada falsos.
Open chart in a new window
Topo duplo
was formed on 28.05 at 16:00:13 (UTC+0)
signal strength 2 of 5
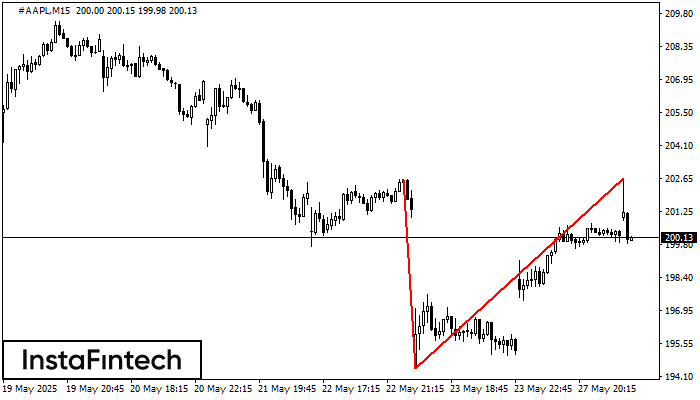
No gráfico de #AAPL M15 o padrão de reversão Topo duplo foi formado. Características: o limite superior 202.68; o limite inferior 194.47; a largura do padrão 821 pontos. O sinal
Os intervalos M5 e M15 podem ter mais pontos de entrada falsos.
Open chart in a new window
Retângulo de baixa
was formed on 28.05 at 15:05:49 (UTC+0)
signal strength 1 of 5
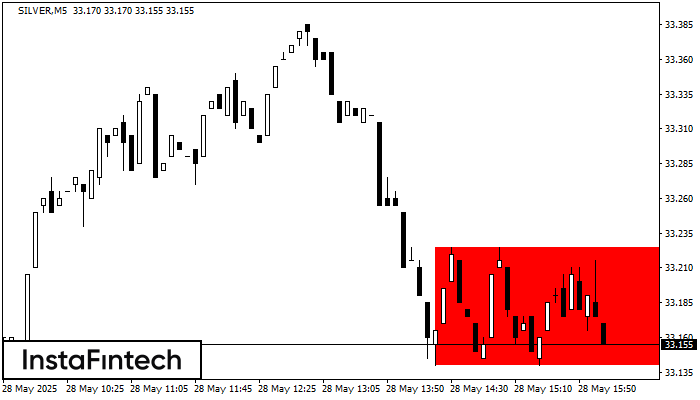
De acordo com o gráfico de M5, SILVER formou Retângulo de baixa. O padrão indica uma continuação da tendência. O limite superior é 33.23, o limite inferior é 33.14
Os intervalos M5 e M15 podem ter mais pontos de entrada falsos.
Open chart in a new window
