

Các mẫu thực tế

Các mẫu là các mô hình đồ họa được hình thành trong biểu đồ theo giá. Theo một trong những định đề phân tích kỹ thuật, lịch sử (chuyển động giá) thường tự lặp lại. Có nghĩa là biến động giá thường giống nhau trong các tình huống giống nhau, do đó có thể dự đoán chuyển động tiếp theo của tình huống với xác suất cao.
Các mẫu hữu quan của InstaTrade là một dịch vụ dễ sử dụng cho phép bạn nhận biết được những thay đổi mới nhất trên thị trường và phản ứng kịp thời với các dấu hiệu từ thị trường. Trong dịch vụ của chúng tôi, bạn sẽ luôn tìm thấy các mẫu mới nhất và phù hợp nhất trên bất kỳ cặp nào và bất kỳ khung thời gian nào.
Bearish pennant
was formed on 03.04 at 20:00:14 (UTC+0)
signal strength 3 of 5
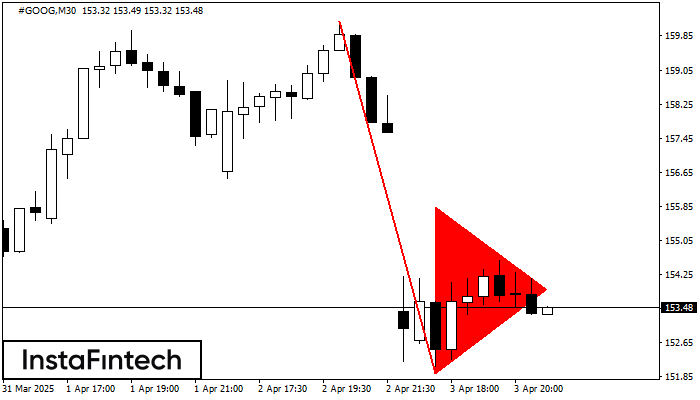
The Bearish pennant pattern has formed on the #GOOG M30 chart. It signals potential continuation of the existing trend. Specifications: the pattern’s bottom has the coordinate of 151.94; the projection of the flagpole height is equal to 824 pips. In case the price breaks out the pattern’s bottom of 151.94, the downtrend is expected to continue for further level 151.64.
- All
- All
- Bearish Rectangle
- Bearish Symmetrical Triangle
- Bearish Symmetrical Triangle
- Bullish Rectangle
- Double Top
- Double Top
- Triple Bottom
- Triple Bottom
- Triple Top
- Triple Top
- All
- All
- Buy
- Sale
- All
- 1
- 2
- 3
- 4
- 5
Đáy đôi
was formed on 21.05 at 05:40:20 (UTC+0)
signal strength 1 of 5
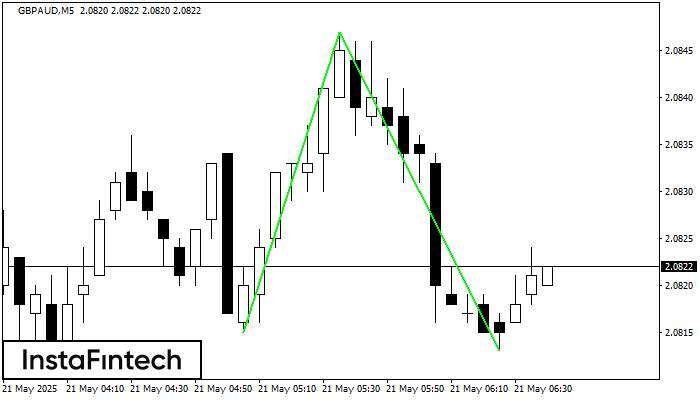
Mô hình Đáy đôi đã được hình thành trên GBPAUD M5; đường viền trên là 2.0847; đường viền dưới là 2.0813. Độ rộng của mô hình là 32 điểm. Trong
Khung thời gian M5 và M15 có thể có nhiều điểm vào lệnh sai hơn.
Open chart in a new window
Tam giác Cân Giảm
was formed on 21.05 at 04:39:41 (UTC+0)
signal strength 3 of 5
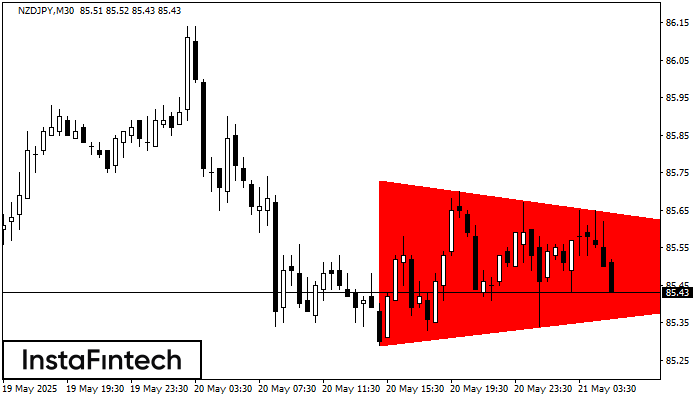
Theo biểu đồ của M30, NZDJPY đã hình thành mô hình Tam giác Cân Giảm. Mô tả: Đường biên giới thấp hơn là 85.29/85.49 và đường biên giới
Open chart in a new window
Hình chữ nhật giảm
was formed on 21.05 at 04:39:35 (UTC+0)
signal strength 3 of 5
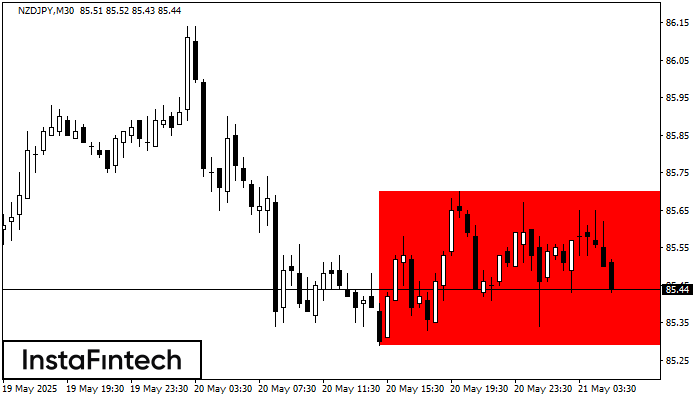
Theo biểu đồ của M30, NZDJPY đã tạo thành Hình chữ nhật giảm. Loại mô hình này cho thấy sự tiếp tục xu hướng
Open chart in a new window
