

Các mẫu thực tế

Các mẫu là các mô hình đồ họa được hình thành trong biểu đồ theo giá. Theo một trong những định đề phân tích kỹ thuật, lịch sử (chuyển động giá) thường tự lặp lại. Có nghĩa là biến động giá thường giống nhau trong các tình huống giống nhau, do đó có thể dự đoán chuyển động tiếp theo của tình huống với xác suất cao.
Các mẫu hữu quan của InstaTrade là một dịch vụ dễ sử dụng cho phép bạn nhận biết được những thay đổi mới nhất trên thị trường và phản ứng kịp thời với các dấu hiệu từ thị trường. Trong dịch vụ của chúng tôi, bạn sẽ luôn tìm thấy các mẫu mới nhất và phù hợp nhất trên bất kỳ cặp nào và bất kỳ khung thời gian nào.
Bearish Symmetrical Triangle
was formed on 01.04 at 09:18:41 (UTC+0)
signal strength 4 of 5

According to the chart of H1, NZDJPY formed the Bearish Symmetrical Triangle pattern. Description: The lower border is 84.61/84.93 and upper border is 85.30/84.93. The pattern width is measured on the chart at -69 pips. The formation of the Bearish Symmetrical Triangle pattern evidently signals a continuation of the downward trend. In other words, if the scenario comes true and NZDJPY breaches the lower border, the price could continue its move toward 84.53.
- All
- All
- Bearish Rectangle
- Bearish Symmetrical Triangle
- Bearish Symmetrical Triangle
- Bullish Rectangle
- Double Top
- Double Top
- Triple Bottom
- Triple Bottom
- Triple Top
- Triple Top
- All
- All
- Buy
- Sale
- All
- 1
- 2
- 3
- 4
- 5
Tam giác Cân Tăng
was formed on 20.05 at 01:48:41 (UTC+0)
signal strength 2 of 5
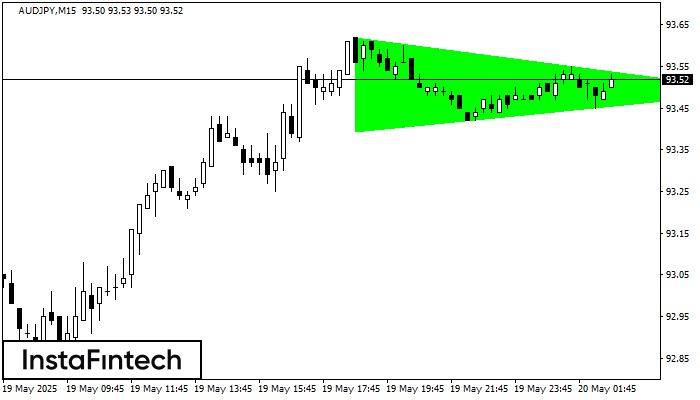
Theo biểu đồ của M15, AUDJPY đã hình thành mô hình Tam giác Cân Tăng. Mô tả: Đây là mô hình của sự tiếp tục xu hướng. 93.62 và 93.39
Khung thời gian M5 và M15 có thể có nhiều điểm vào lệnh sai hơn.
Open chart in a new window
Tam giác Cân Tăng
was formed on 20.05 at 01:45:38 (UTC+0)
signal strength 1 of 5
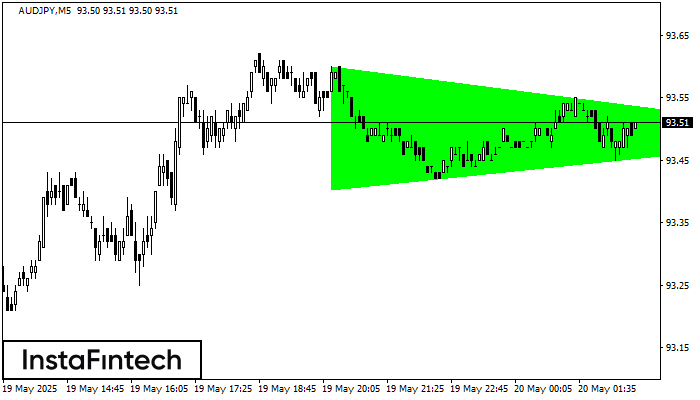
Theo biểu đồ của M5, AUDJPY đã hình thành mô hình Tam giác Cân Tăng, điều mà báo hiệu xu hướng sẽ tiếp tục. Mô tả. Đường biên giới
Khung thời gian M5 và M15 có thể có nhiều điểm vào lệnh sai hơn.
Open chart in a new window
Tam giác Cân Tăng
was formed on 20.05 at 01:38:45 (UTC+0)
signal strength 2 of 5
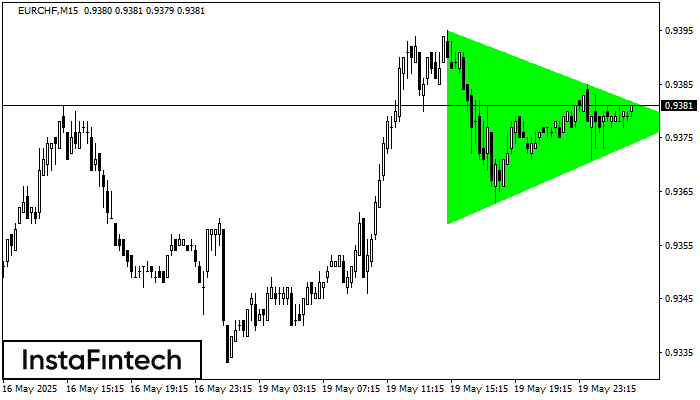
Theo biểu đồ của M15, EURCHF đã hình thành mô hình Tam giác Cân Tăng. Mô tả: Đây là mô hình của sự tiếp tục xu hướng. 0.9395 và 0.9359
Khung thời gian M5 và M15 có thể có nhiều điểm vào lệnh sai hơn.
Open chart in a new window
