

Các mẫu thực tế

Các mẫu là các mô hình đồ họa được hình thành trong biểu đồ theo giá. Theo một trong những định đề phân tích kỹ thuật, lịch sử (chuyển động giá) thường tự lặp lại. Có nghĩa là biến động giá thường giống nhau trong các tình huống giống nhau, do đó có thể dự đoán chuyển động tiếp theo của tình huống với xác suất cao.
Các mẫu hữu quan của InstaTrade là một dịch vụ dễ sử dụng cho phép bạn nhận biết được những thay đổi mới nhất trên thị trường và phản ứng kịp thời với các dấu hiệu từ thị trường. Trong dịch vụ của chúng tôi, bạn sẽ luôn tìm thấy các mẫu mới nhất và phù hợp nhất trên bất kỳ cặp nào và bất kỳ khung thời gian nào.
Inverse Head and Shoulder
was formed on 28.03 at 20:16:00 (UTC+0)
signal strength 1 of 5
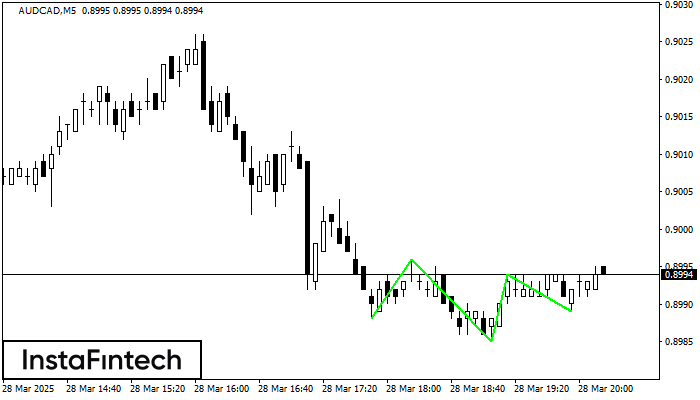
According to the chart of M5, AUDCAD produced the pattern termed the Inverse Head and Shoulder. The Head is fixed at 0.8985 while the median line of the Neck is set at 0.8996/0.8994. The formation of the Inverse Head and Shoulder Pattern clearly indicates a reversal of the downward trend. In means that in case the scenario comes true, the price of AUDCAD will go towards 0.9009.
The M5 and M15 time frames may have more false entry points.
- All
- All
- Bearish Rectangle
- Bearish Symmetrical Triangle
- Bearish Symmetrical Triangle
- Bullish Rectangle
- Double Top
- Double Top
- Triple Bottom
- Triple Bottom
- Triple Top
- Triple Top
- All
- All
- Buy
- Sale
- All
- 1
- 2
- 3
- 4
- 5
Retângulo de baixa
was formed on 27.04 at 06:31:28 (UTC+0)
signal strength 1 of 5

De acordo com o gráfico de M5, #Bitcoin formou Retângulo de baixa. O padrão indica uma continuação da tendência. O limite superior é 94251.10, o limite inferior é 94078.08
Os intervalos M5 e M15 podem ter mais pontos de entrada falsos.
Open chart in a new window
Fundo triplo
was formed on 27.04 at 06:11:24 (UTC+0)
signal strength 1 of 5

O padrão Fundo triplo foi formado no gráfico de #Bitcoin M5. Características do padrão: A linha inferior do padrão tem coordenadas 94416.04 com o limite superior 94416.04/94251.10, a projeção
Os intervalos M5 e M15 podem ter mais pontos de entrada falsos.
Open chart in a new window
Topo triplo
was formed on 26.04 at 20:16:22 (UTC+0)
signal strength 1 of 5

No gráfico do instrumento de negociação #Bitcoin M5, o padrão Topo triplo que sinaliza uma mudança de tendência se formou. É possível que após a formação do terceiro pico
Os intervalos M5 e M15 podem ter mais pontos de entrada falsos.
Open chart in a new window
