

Các mẫu thực tế

Các mẫu là các mô hình đồ họa được hình thành trong biểu đồ theo giá. Theo một trong những định đề phân tích kỹ thuật, lịch sử (chuyển động giá) thường tự lặp lại. Có nghĩa là biến động giá thường giống nhau trong các tình huống giống nhau, do đó có thể dự đoán chuyển động tiếp theo của tình huống với xác suất cao.
Các mẫu hữu quan của InstaTrade là một dịch vụ dễ sử dụng cho phép bạn nhận biết được những thay đổi mới nhất trên thị trường và phản ứng kịp thời với các dấu hiệu từ thị trường. Trong dịch vụ của chúng tôi, bạn sẽ luôn tìm thấy các mẫu mới nhất và phù hợp nhất trên bất kỳ cặp nào và bất kỳ khung thời gian nào.
Bearish Symmetrical Triangle
was formed on 24.03 at 03:05:44 (UTC+0)
signal strength 1 of 5
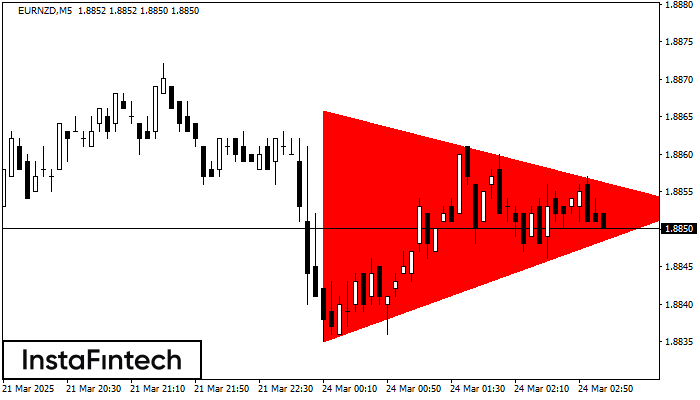
According to the chart of M5, EURNZD formed the Bearish Symmetrical Triangle pattern. Description: The lower border is 1.8835/1.8853 and upper border is 1.8866/1.8853. The pattern width is measured on the chart at -31 pips. The formation of the Bearish Symmetrical Triangle pattern evidently signals a continuation of the downward trend. In other words, if the scenario comes true and EURNZD breaches the lower border, the price could continue its move toward 1.8838.
The M5 and M15 time frames may have more false entry points.
Xem thêm
- All
- All
- Bearish Rectangle
- Bearish Symmetrical Triangle
- Bearish Symmetrical Triangle
- Bullish Rectangle
- Double Top
- Double Top
- Triple Bottom
- Triple Bottom
- Triple Top
- Triple Top
- All
- All
- Buy
- Sale
- All
- 1
- 2
- 3
- 4
- 5
Teratas Ganda
was formed on 07.05 at 14:00:35 (UTC+0)
signal strength 3 of 5
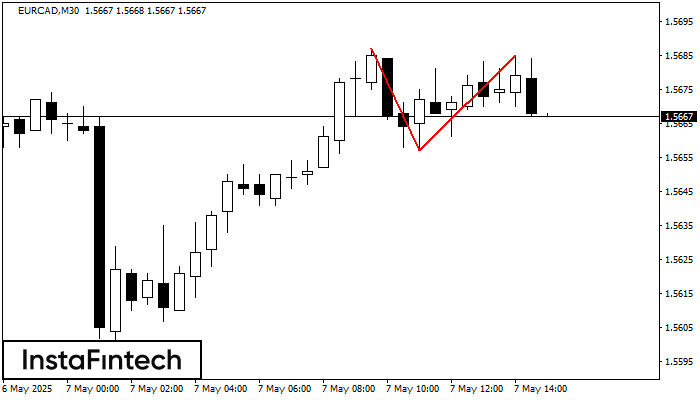
Pola reversal Teratas Ganda telah terbentuk pada EURCAD M30. Karakteristik: batas atas 1.5687; batas bawah 1.5657; lebar pola 28 poin. Transaksi jual lebih baik dibuka di bawah batas bawah 1.5657
Open chart in a new window
Teratas Triple
was formed on 07.05 at 14:00:25 (UTC+0)
signal strength 2 of 5
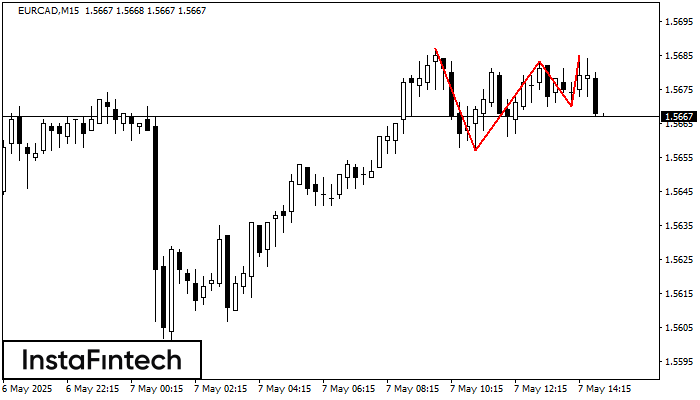
Pada grafik instrumen trading EURCAD M15, pola Teratas Triple yang menandakan perubahan trend telah terbentuk. Ada kemungkinan bahwa setelah pembentukan puncak (peak) ketiga, harga akan mencoba untuk menembus level resistance
Rangka waktu M5 dan M15 mungkin memiliki lebih dari titik entri yang keliru.
Open chart in a new window
Bawah Ganda
was formed on 07.05 at 12:39:47 (UTC+0)
signal strength 1 of 5
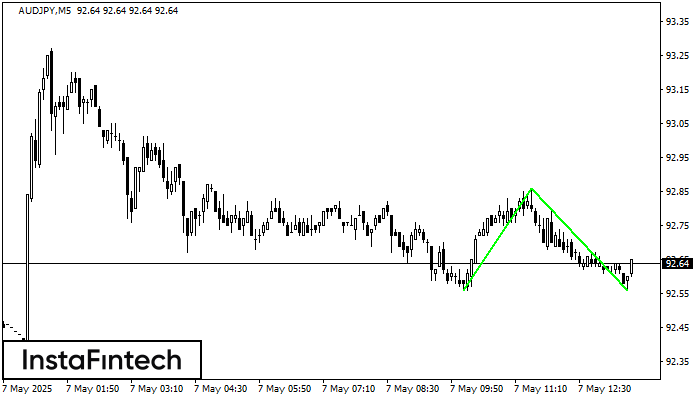
Pola Bawah Ganda telah terbentuk pada AUDJPY M5; batas atas di 92.86; batas bawah di 92.56. Lebar pola sebesar 30 poin. Jika harga menembus batas atas 92.86, Perubahan dalam tren
Rangka waktu M5 dan M15 mungkin memiliki lebih dari titik entri yang keliru.
Open chart in a new window
