

Dolzarb patternlar

Двойное дно
сформирован 28.04 в 06:30:41 (UTC+0)
сила сигнала 3 из 5
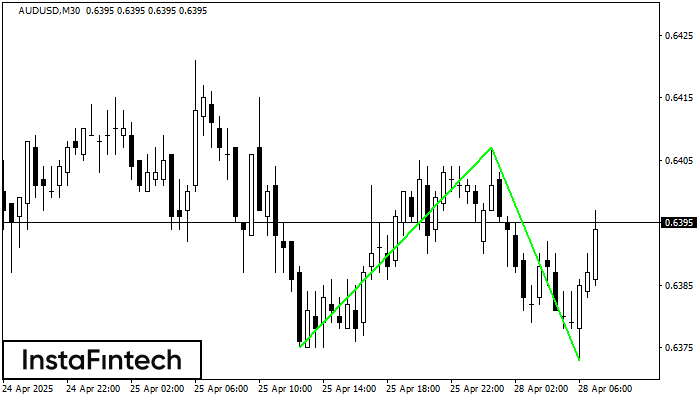
Сформирована фигура «Двойное дно» на графике AUDUSD M30. Данное формирование сигнализирует об изменении тенденции с нисходящего на восходящее движение. Сигнал: Торговую позицию на покупку следует открывать после пробоя верхней границы фигуры 0.6407, где перспектива будущего хода будет являться шириной текущей фигуры - 32 пунктов.
- Все
- Все
- Bearish Rectangle
- Bearish Symmetrical Triangle
- Bearish Symmetrical Triangle
- Bullish Rectangle
- Double Top
- Double Top
- Triple Bottom
- Triple Bottom
- Triple Top
- Triple Top
- Все
- Все
- Покупка
- Продажа
- Все
- 1
- 2
- 3
- 4
- 5
Double Top
was formed on 13.05 at 00:30:10 (UTC+0)
signal strength 1 of 5
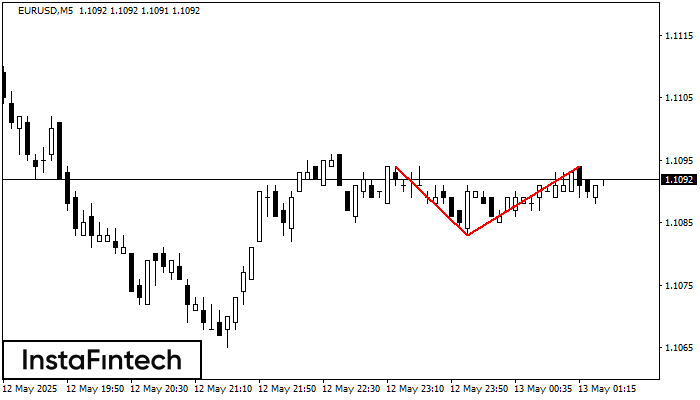
The Double Top reversal pattern has been formed on EURUSD M5. Characteristics: the upper boundary 1.1094; the lower boundary 1.1083; the width of the pattern is 11 points. Sell trades
The M5 and M15 time frames may have more false entry points.
Open chart in a new window
Bearish Symmetrical Triangle
was formed on 13.05 at 00:18:16 (UTC+0)
signal strength 1 of 5
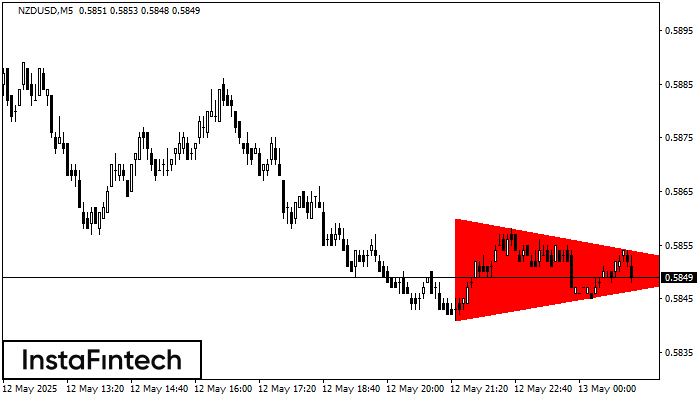
According to the chart of M5, NZDUSD formed the Bearish Symmetrical Triangle pattern. Trading recommendations: A breach of the lower border 0.5841 is likely to encourage a continuation
The M5 and M15 time frames may have more false entry points.
Open chart in a new window
Double Top
was formed on 13.05 at 00:00:08 (UTC+0)
signal strength 4 of 5
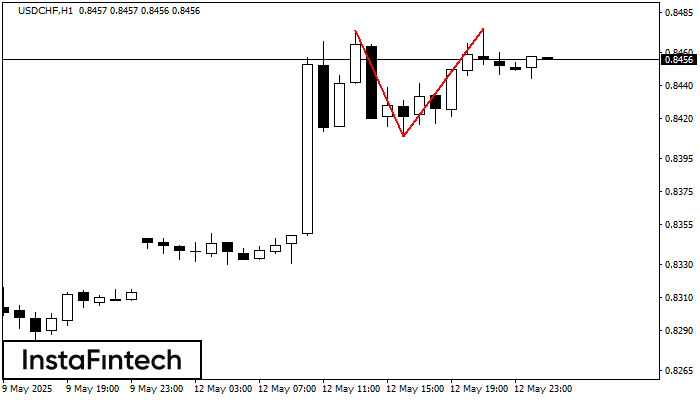
The Double Top reversal pattern has been formed on USDCHF H1. Characteristics: the upper boundary 0.8474; the lower boundary 0.8409; the width of the pattern is 66 points. Sell trades
Open chart in a new window


