

Dolzarb patternlar

Тройное дно
сформирован 28.04 в 06:30:09 (UTC+0)
сила сигнала 3 из 5
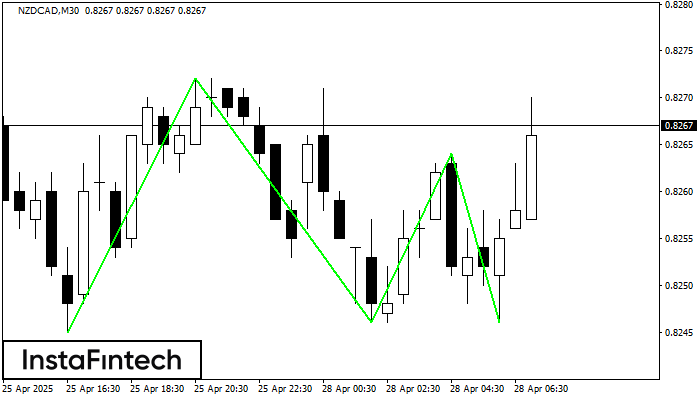
Сформирована фигура «Тройное дно» по торговому инструменту NZDCAD на M30. Фигура сигнализирует об изменении тенденции с нисходящей на восходящую в случае пробоя верхней границы 0.8264.
- Все
- Все
- Bearish Rectangle
- Bearish Symmetrical Triangle
- Bearish Symmetrical Triangle
- Bullish Rectangle
- Double Top
- Double Top
- Triple Bottom
- Triple Bottom
- Triple Top
- Triple Top
- Все
- Все
- Покупка
- Продажа
- Все
- 1
- 2
- 3
- 4
- 5
Bullish Rectangle
сформирован 09.05 в 12:45:28 (UTC+0)
сила сигнала 2 из 5
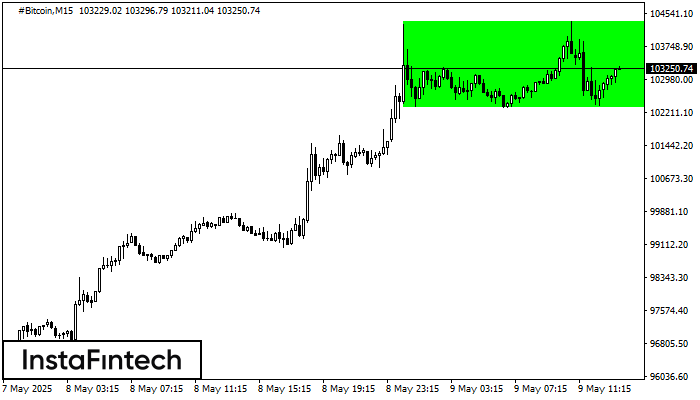
According to the chart of M15, #Bitcoin formed the Bullish Rectangle which is a pattern of a trend continuation. The pattern is contained within the following borders: the lower border
The M5 and M15 time frames may have more false entry points.
Открыть график инструмента в новом окне
Bearish Symmetrical Triangle
сформирован 09.05 в 12:20:11 (UTC+0)
сила сигнала 1 из 5
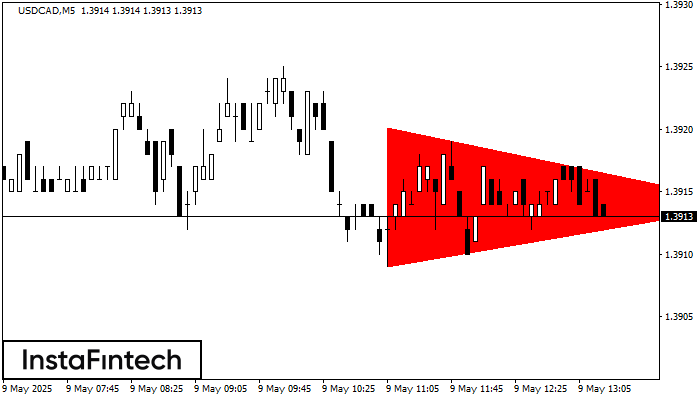
According to the chart of M5, USDCAD formed the Bearish Symmetrical Triangle pattern. Description: The lower border is 1.3909/1.3914 and upper border is 1.3920/1.3914. The pattern width is measured
The M5 and M15 time frames may have more false entry points.
Открыть график инструмента в новом окне
Triple Top
сформирован 09.05 в 12:14:47 (UTC+0)
сила сигнала 2 из 5
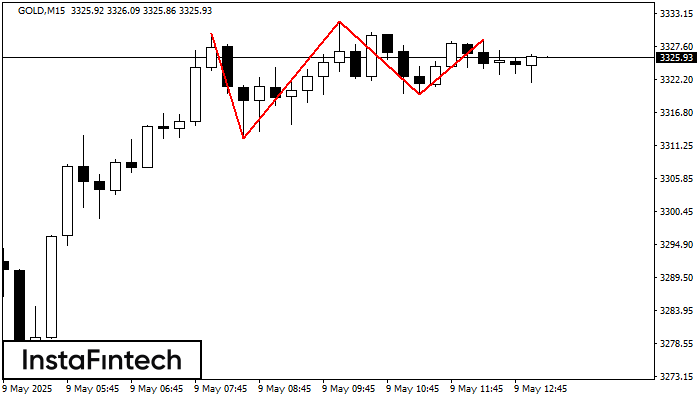
On the chart of the GOLD M15 trading instrument, the Triple Top pattern that signals a trend change has formed. It is possible that after formation of the third peak
The M5 and M15 time frames may have more false entry points.
Открыть график инструмента в новом окне
