

Dolzarb patternlar

Двойное дно
сформирован 27.04 в 16:59:46 (UTC+0)
сила сигнала 4 из 5
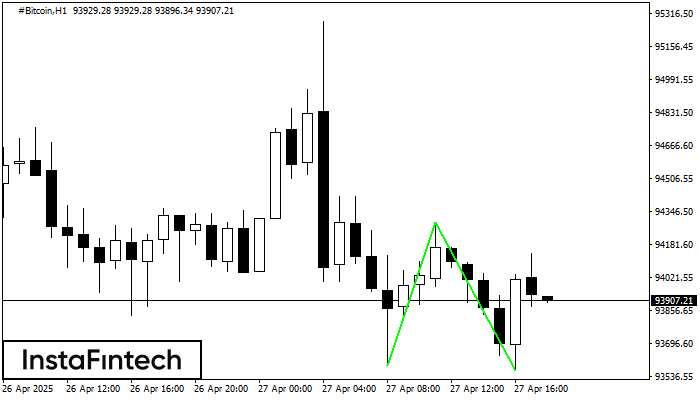
Сформирована фигура «Двойное дно» на графике #Bitcoin H1. Данное формирование сигнализирует об изменении тенденции с нисходящего на восходящее движение. Сигнал: Торговую позицию на покупку следует открывать после пробоя верхней границы фигуры 94291.97, где перспектива будущего хода будет являться шириной текущей фигуры - 70503 пунктов.
- Все
- Все
- Bearish Rectangle
- Bearish Symmetrical Triangle
- Bearish Symmetrical Triangle
- Bullish Rectangle
- Double Top
- Double Top
- Triple Bottom
- Triple Bottom
- Triple Top
- Triple Top
- Все
- Все
- Покупка
- Продажа
- Все
- 1
- 2
- 3
- 4
- 5
Triple Bottom
сформирован 14.05 в 07:32:26 (UTC+0)
сила сигнала 2 из 5
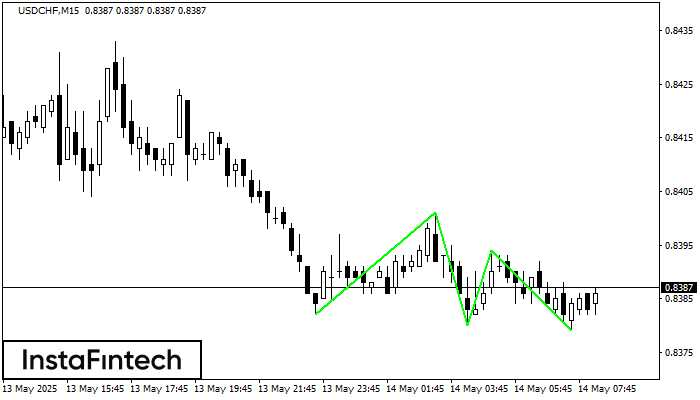
The Triple Bottom pattern has been formed on USDCHF M15. It has the following characteristics: resistance level 0.8401/0.8394; support level 0.8382/0.8379; the width is 19 points. In the event
The M5 and M15 time frames may have more false entry points.
Открыть график инструмента в новом окне
Bullish Rectangle
сформирован 14.05 в 07:17:39 (UTC+0)
сила сигнала 2 из 5
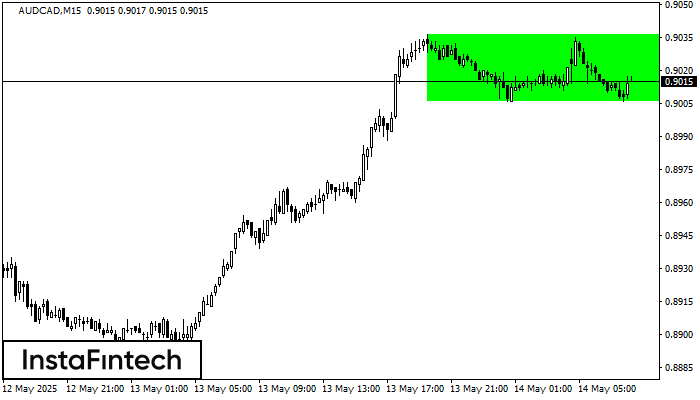
According to the chart of M15, AUDCAD formed the Bullish Rectangle which is a pattern of a trend continuation. The pattern is contained within the following borders: the lower border
The M5 and M15 time frames may have more false entry points.
Открыть график инструмента в новом окне
Bullish Symmetrical Triangle
сформирован 14.05 в 07:14:22 (UTC+0)
сила сигнала 1 из 5
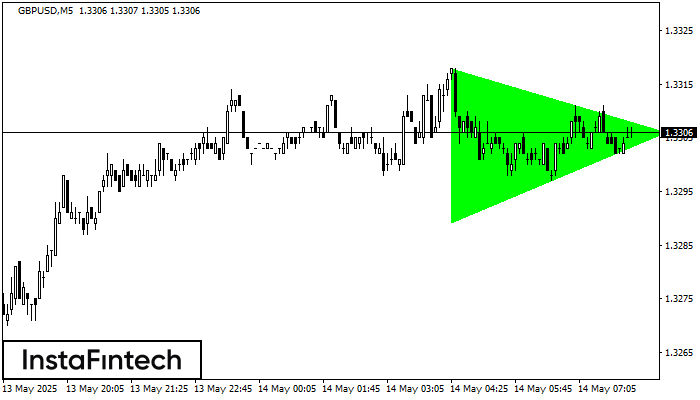
According to the chart of M5, GBPUSD formed the Bullish Symmetrical Triangle pattern. The lower border of the pattern touches the coordinates 1.3289/1.3306 whereas the upper border goes across 1.3318/1.3306
The M5 and M15 time frames may have more false entry points.
Открыть график инструмента в новом окне


