

Dolzarb patternlar

Двойная вершина
сформирован 26.04 в 18:20:15 (UTC+0)
сила сигнала 1 из 5
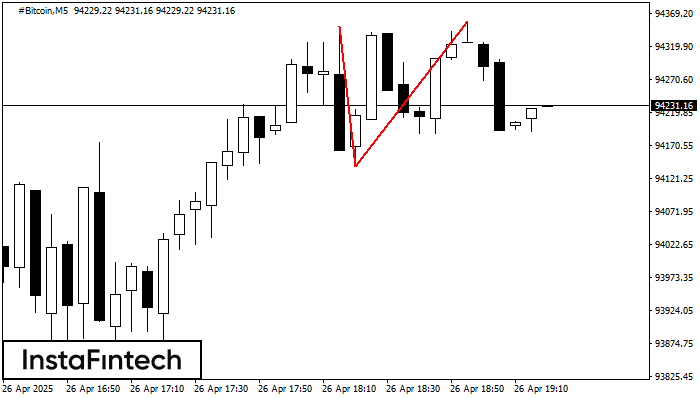
По #Bitcoin на M5 сформировалась разворотная фигура «Двойная вершина». Характеристика: Верхняя граница 94348.84; Нижняя граница 94140.31; Ширина фигуры 21661 пунктов. Позицию на продажу возможно открыть ниже нижней границы 94140.31, с перспективой хода к уровню 94140.16.
Таймфреймы М5 и М15 могут иметь больше ложных точек входа.
- Все
- Все
- Bearish Rectangle
- Bearish Symmetrical Triangle
- Bearish Symmetrical Triangle
- Bullish Rectangle
- Double Top
- Double Top
- Triple Bottom
- Triple Bottom
- Triple Top
- Triple Top
- Все
- Все
- Покупка
- Продажа
- Все
- 1
- 2
- 3
- 4
- 5
Double Top
was formed on 20.05 at 08:30:30 (UTC+0)
signal strength 1 of 5
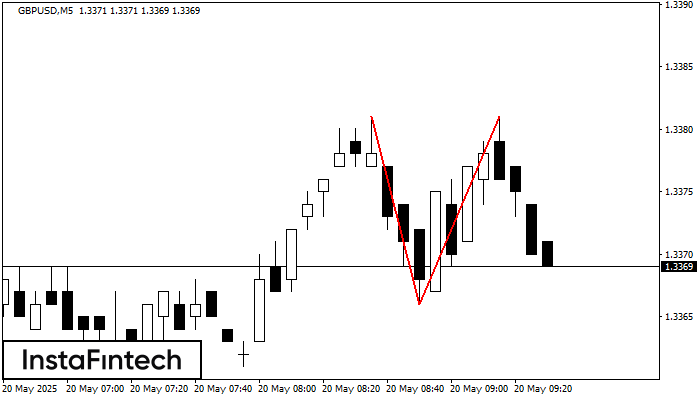
The Double Top pattern has been formed on GBPUSD M5. It signals that the trend has been changed from upwards to downwards. Probably, if the base of the pattern 1.3366
The M5 and M15 time frames may have more false entry points.
Open chart in a new window
Double Top
was formed on 20.05 at 07:40:53 (UTC+0)
signal strength 1 of 5
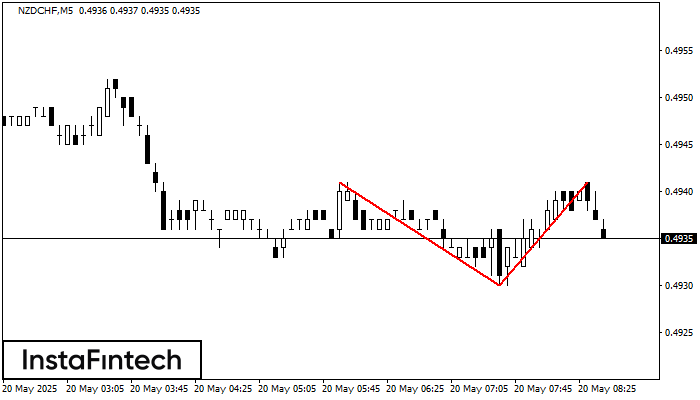
On the chart of NZDCHF M5 the Double Top reversal pattern has been formed. Characteristics: the upper boundary 0.4941; the lower boundary 0.4930; the width of the pattern 11 points
The M5 and M15 time frames may have more false entry points.
Open chart in a new window
Bullish Rectangle
was formed on 20.05 at 07:30:33 (UTC+0)
signal strength 4 of 5
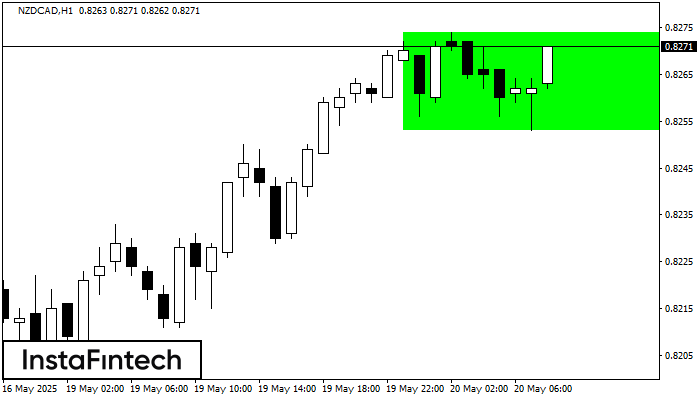
According to the chart of H1, NZDCAD formed the Bullish Rectangle. This type of a pattern indicates a trend continuation. It consists of two levels: resistance 0.8274 and support 0.8253
Open chart in a new window


