

Dolzarb patternlar

Прямоугольник
сформирован 24.04 в 18:29:03 (UTC+0)
сила сигнала 4 из 5
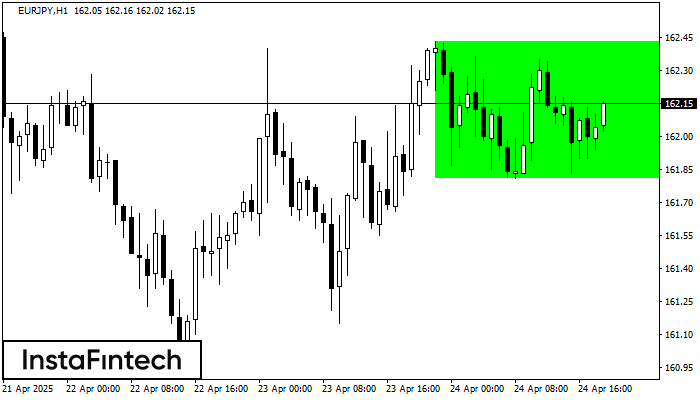
Сформирована фигура «Прямоугольник» на графике EURJPY H1. Тип фигуры: Продолжение тренда; Границы: Верхняя 162.43, Нижняя 161.81; Сигнал: позицию на покупку следует открывать выше верхней границы прямоугольника 162.43.
- Все
- Все
- Bearish Rectangle
- Bearish Symmetrical Triangle
- Bearish Symmetrical Triangle
- Bullish Rectangle
- Double Top
- Double Top
- Triple Bottom
- Triple Bottom
- Triple Top
- Triple Top
- Все
- Все
- Покупка
- Продажа
- Все
- 1
- 2
- 3
- 4
- 5
Bearish pennant
сформирован 19.05 в 17:25:09 (UTC+0)
сила сигнала 1 из 5
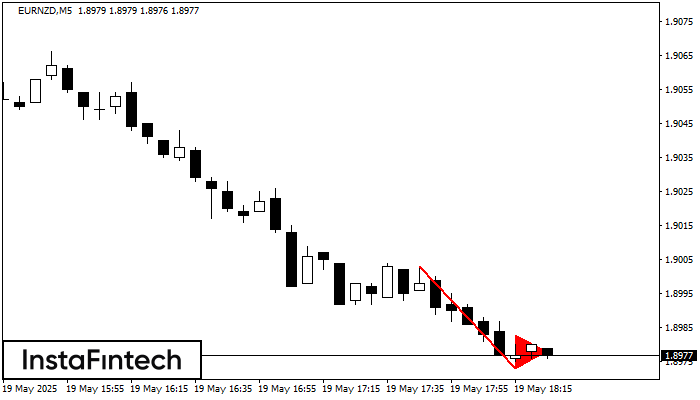
The Bearish pennant pattern has formed on the EURNZD M5 chart. This pattern type is characterized by a slight slowdown after which the price will move in the direction
The M5 and M15 time frames may have more false entry points.
Открыть график инструмента в новом окне
Bullish pennant
сформирован 19.05 в 17:04:50 (UTC+0)
сила сигнала 1 из 5
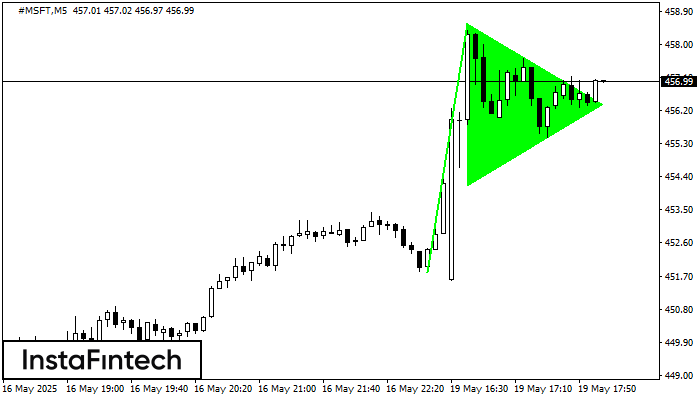
The Bullish pennant graphic pattern has formed on the #MSFT M5 instrument. This pattern type falls under the category of continuation patterns. In this case, if the quote can breaks
The M5 and M15 time frames may have more false entry points.
Открыть график инструмента в новом окне
Double Bottom
сформирован 19.05 в 16:49:52 (UTC+0)
сила сигнала 1 из 5
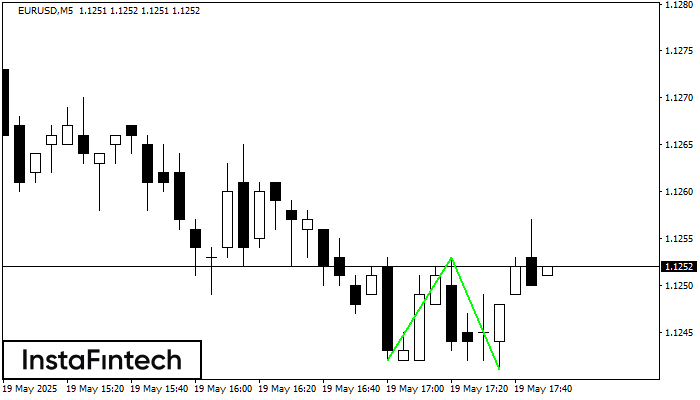
The Double Bottom pattern has been formed on EURUSD M5. Characteristics: the support level 1.1242; the resistance level 1.1253; the width of the pattern 11 points. If the resistance level
The M5 and M15 time frames may have more false entry points.
Открыть график инструмента в новом окне


