

Dolzarb patternlar

Двойное дно
сформирован 23.04 в 15:30:42 (UTC+0)
сила сигнала 5 из 5

Сформирована фигура «Двойное дно» на графике #FB D1. Характеристика: Уровень поддержки 482.05; Уровень сопротивления 587.72; Ширина фигуры 10567 пунктов. В случае пробоя уровня сопротивления можно будет прогнозировать изменение тенденции, где первая точка фиксации прибыли находится на расстоянии 10777 пунктов.
Shuningdek ko'ring
- Все
- Все
- Bearish Rectangle
- Bearish Symmetrical Triangle
- Bearish Symmetrical Triangle
- Bullish Rectangle
- Double Top
- Double Top
- Triple Bottom
- Triple Bottom
- Triple Top
- Triple Top
- Все
- Все
- Покупка
- Продажа
- Все
- 1
- 2
- 3
- 4
- 5
Bullish Rectangle
сформирован 27.05 в 21:40:25 (UTC+0)
сила сигнала 1 из 5
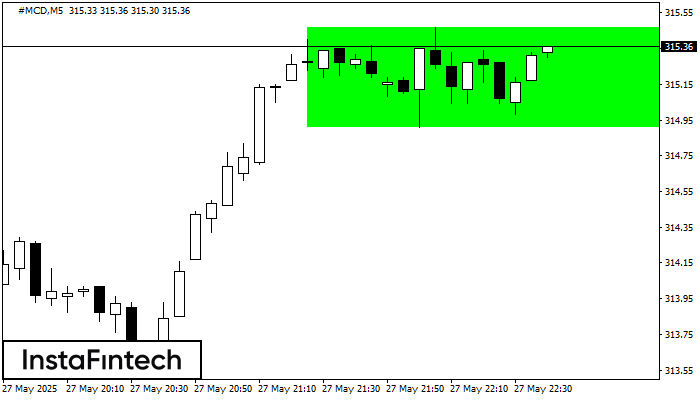
According to the chart of M5, #MCD formed the Bullish Rectangle. The pattern indicates a trend continuation. The upper border is 315.47, the lower border is 314.91. The signal means
The M5 and M15 time frames may have more false entry points.
Открыть график инструмента в новом окне
Double Top
сформирован 27.05 в 21:35:15 (UTC+0)
сила сигнала 1 из 5
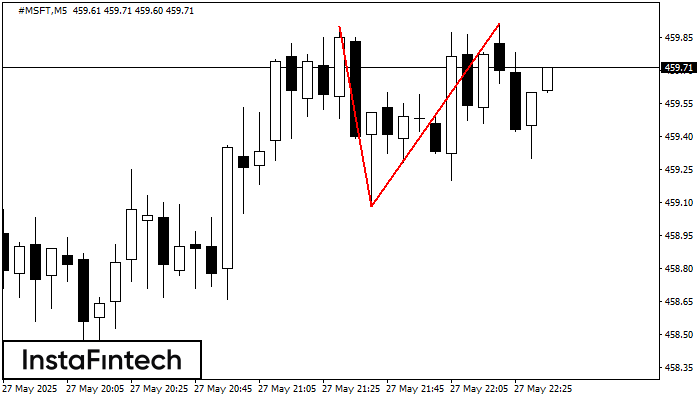
On the chart of #MSFT M5 the Double Top reversal pattern has been formed. Characteristics: the upper boundary 459.91; the lower boundary 459.08; the width of the pattern 83 points
The M5 and M15 time frames may have more false entry points.
Открыть график инструмента в новом окне
Double Top
сформирован 27.05 в 21:30:25 (UTC+0)
сила сигнала 1 из 5
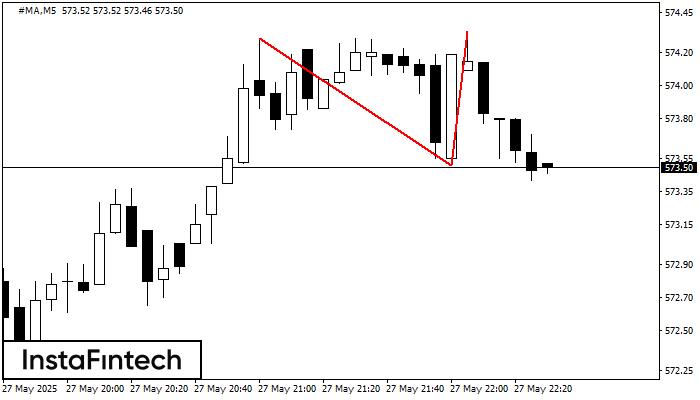
On the chart of #MA M5 the Double Top reversal pattern has been formed. Characteristics: the upper boundary 574.33; the lower boundary 573.51; the width of the pattern 82 points
The M5 and M15 time frames may have more false entry points.
Открыть график инструмента в новом окне


