

Dolzarb patternlar

Двойная вершина
сформирован 17.04 в 20:50:23 (UTC+0)
сила сигнала 1 из 5
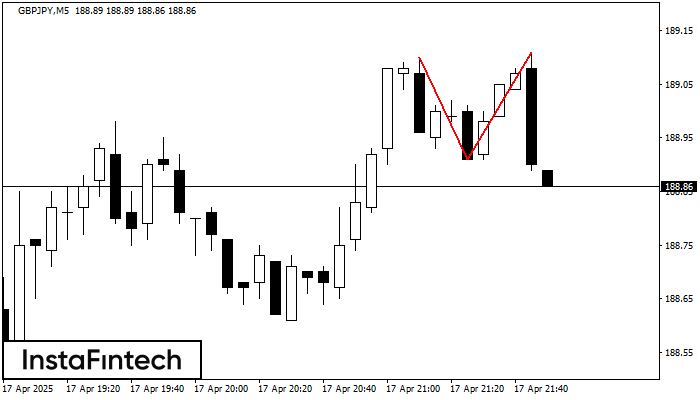
По GBPJPY на M5 сформировалась разворотная фигура «Двойная вершина». Характеристика: Верхняя граница 189.10; Нижняя граница 188.91; Ширина фигуры 20 пунктов. Позицию на продажу возможно открыть ниже нижней границы 188.91, с перспективой хода к уровню 188.76.
Таймфреймы М5 и М15 могут иметь больше ложных точек входа.
- Все
- Все
- Bearish Rectangle
- Bearish Symmetrical Triangle
- Bearish Symmetrical Triangle
- Bullish Rectangle
- Double Top
- Double Top
- Triple Bottom
- Triple Bottom
- Triple Top
- Triple Top
- Все
- Все
- Покупка
- Продажа
- Все
- 1
- 2
- 3
- 4
- 5
Double Bottom
сформирован 13.06 в 18:45:28 (UTC+0)
сила сигнала 1 из 5
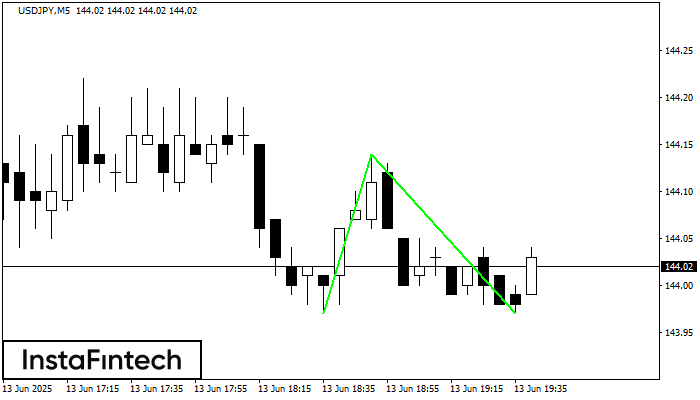
The Double Bottom pattern has been formed on USDJPY M5. This formation signals a reversal of the trend from downwards to upwards. The signal is that a buy trade should
The M5 and M15 time frames may have more false entry points.
Открыть график инструмента в новом окне
Double Top
сформирован 13.06 в 18:30:20 (UTC+0)
сила сигнала 1 из 5
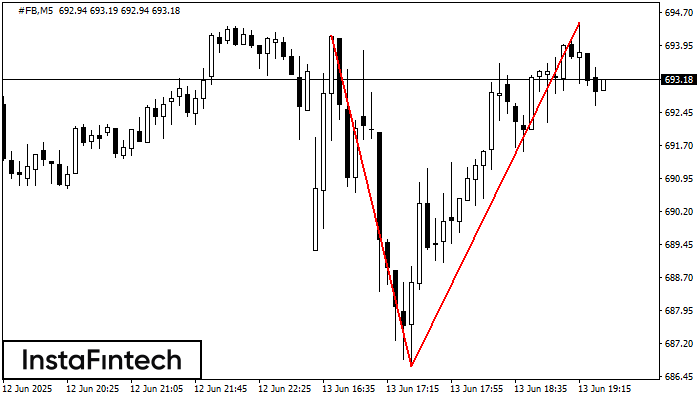
On the chart of #FB M5 the Double Top reversal pattern has been formed. Characteristics: the upper boundary 694.47; the lower boundary 686.69; the width of the pattern 778 points
The M5 and M15 time frames may have more false entry points.
Открыть график инструмента в новом окне
Bullish Rectangle
сформирован 13.06 в 18:21:09 (UTC+0)
сила сигнала 1 из 5
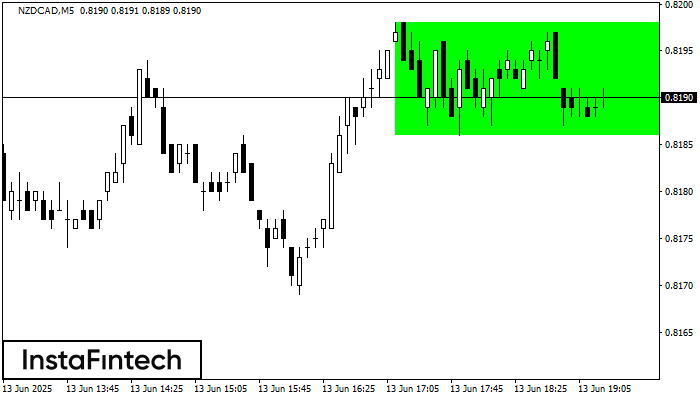
According to the chart of M5, NZDCAD formed the Bullish Rectangle which is a pattern of a trend continuation. The pattern is contained within the following borders: the lower border
The M5 and M15 time frames may have more false entry points.
Открыть график инструмента в новом окне


