

Dolzarb patternlar

Двойное дно
сформирован 17.04 в 20:20:19 (UTC+0)
сила сигнала 1 из 5

Сформирована фигура «Двойное дно» на графике EURNZD M5. Характеристика: Уровень поддержки 1.8992; Уровень сопротивления 1.9020; Ширина фигуры 28 пунктов. В случае пробоя уровня сопротивления можно будет прогнозировать изменение тенденции, где первая точка фиксации прибыли находится на расстоянии 26 пунктов.
Таймфреймы М5 и М15 могут иметь больше ложных точек входа.
- Все
- Все
- Bearish Rectangle
- Bearish Symmetrical Triangle
- Bearish Symmetrical Triangle
- Bullish Rectangle
- Double Top
- Double Top
- Triple Bottom
- Triple Bottom
- Triple Top
- Triple Top
- Все
- Все
- Покупка
- Продажа
- Все
- 1
- 2
- 3
- 4
- 5
Double Bottom
сформирован 06.06 в 13:00:02 (UTC+0)
сила сигнала 2 из 5
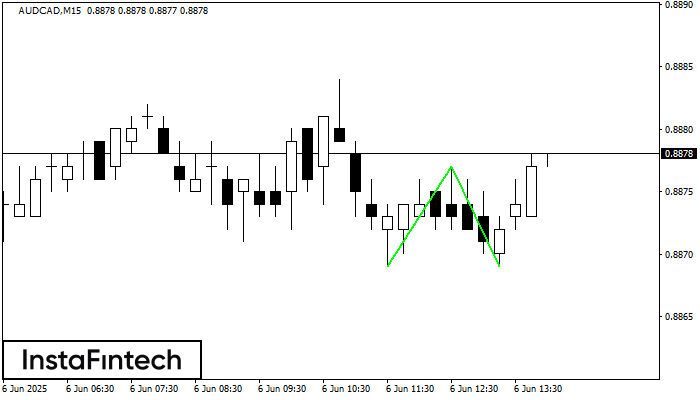
The Double Bottom pattern has been formed on AUDCAD M15; the upper boundary is 0.8877; the lower boundary is 0.8869. The width of the pattern is 8 points. In case
The M5 and M15 time frames may have more false entry points.
Открыть график инструмента в новом окне
Bullish Symmetrical Triangle
сформирован 06.06 в 12:58:19 (UTC+0)
сила сигнала 4 из 5
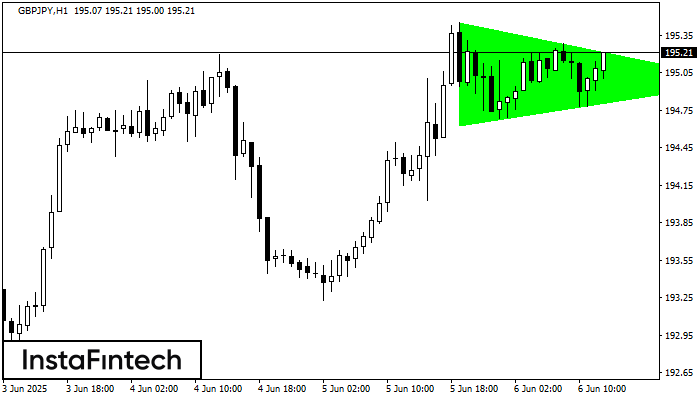
According to the chart of H1, GBPJPY formed the Bullish Symmetrical Triangle pattern. The lower border of the pattern touches the coordinates 194.63/194.98 whereas the upper border goes across 195.45/194.98
Открыть график инструмента в новом окне
Double Bottom
сформирован 06.06 в 12:31:13 (UTC+0)
сила сигнала 1 из 5
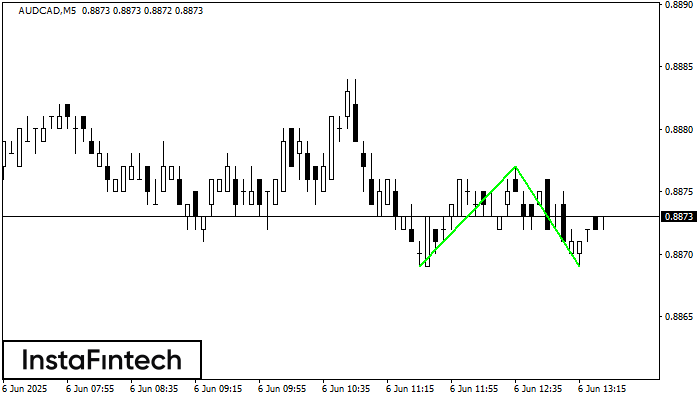
The Double Bottom pattern has been formed on AUDCAD M5. This formation signals a reversal of the trend from downwards to upwards. The signal is that a buy trade should
The M5 and M15 time frames may have more false entry points.
Открыть график инструмента в новом окне


