

Dolzarb patternlar

Бычий вымпел
сформирован 16.04 в 09:47:13 (UTC+0)
сила сигнала 1 из 5
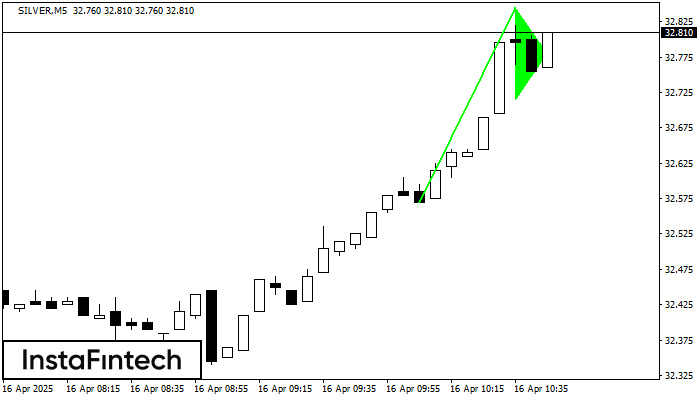
На графике SILVER M5 сформировался паттерн «Бычий вымпел», который относится к фигуре продолжения тренда. Можно предполагать, что, в случае фиксации цены выше максимума вымпела 32.84, возможно дальнейшее восходящее движение.
Таймфреймы М5 и М15 могут иметь больше ложных точек входа.
Shuningdek ko'ring
- Все
- Все
- Bearish Rectangle
- Bearish Symmetrical Triangle
- Bearish Symmetrical Triangle
- Bullish Rectangle
- Double Top
- Double Top
- Triple Bottom
- Triple Bottom
- Triple Top
- Triple Top
- Все
- Все
- Покупка
- Продажа
- Все
- 1
- 2
- 3
- 4
- 5
Bullish Rectangle
сформирован 13.06 в 11:00:28 (UTC+0)
сила сигнала 1 из 5
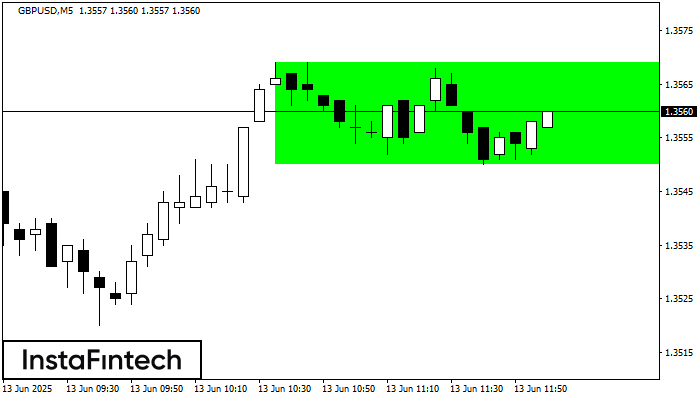
According to the chart of M5, GBPUSD formed the Bullish Rectangle. This type of a pattern indicates a trend continuation. It consists of two levels: resistance 1.3569 and support 1.3550
The M5 and M15 time frames may have more false entry points.
Открыть график инструмента в новом окне
Double Bottom
сформирован 13.06 в 10:15:43 (UTC+0)
сила сигнала 2 из 5
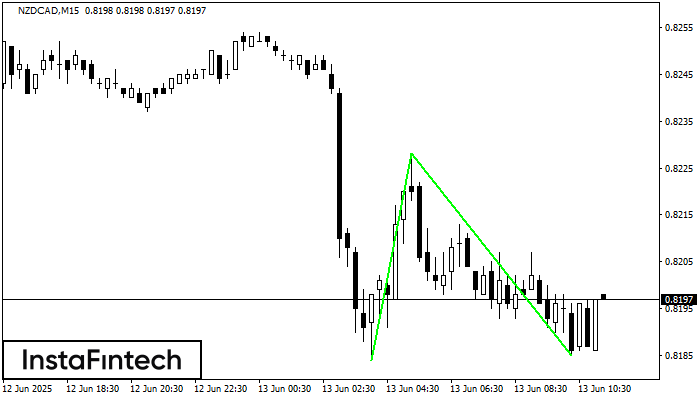
The Double Bottom pattern has been formed on NZDCAD M15. This formation signals a reversal of the trend from downwards to upwards. The signal is that a buy trade should
The M5 and M15 time frames may have more false entry points.
Открыть график инструмента в новом окне
Triple Bottom
сформирован 13.06 в 09:45:15 (UTC+0)
сила сигнала 2 из 5
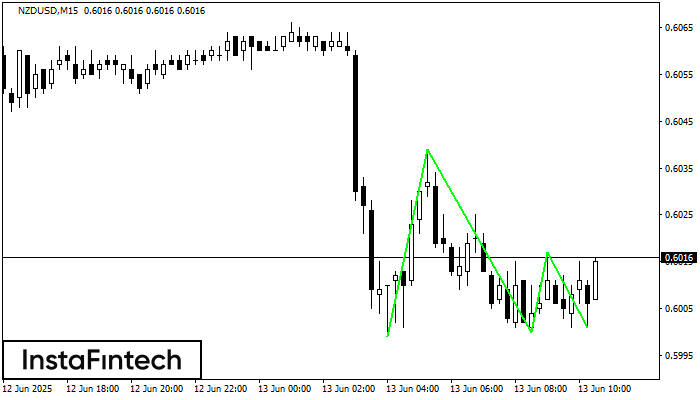
The Triple Bottom pattern has been formed on NZDUSD M15. It has the following characteristics: resistance level 0.6039/0.6017; support level 0.5999/0.6001; the width is 40 points. In the event
The M5 and M15 time frames may have more false entry points.
Открыть график инструмента в новом окне


