

Dolzarb patternlar

Двойное дно
сформирован 16.04 в 05:15:27 (UTC+0)
сила сигнала 1 из 5
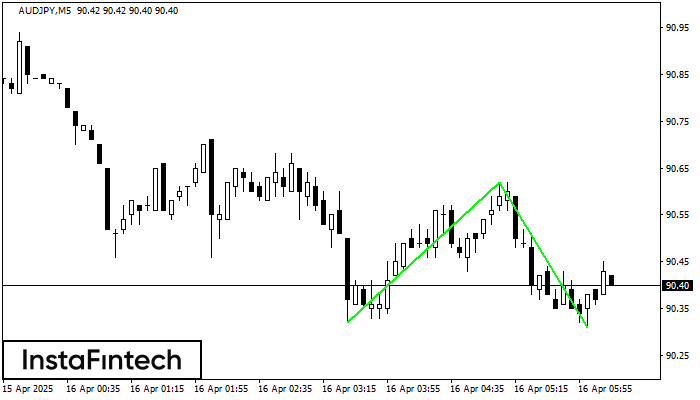
Сформирована фигура «Двойное дно» на графике AUDJPY M5. Характеристика: Уровень поддержки 90.32; Уровень сопротивления 90.62; Ширина фигуры 30 пунктов. В случае пробоя уровня сопротивления можно будет прогнозировать изменение тенденции, где первая точка фиксации прибыли находится на расстоянии 31 пунктов.
Таймфреймы М5 и М15 могут иметь больше ложных точек входа.
Shuningdek ko'ring
- Все
- Все
- Bearish Rectangle
- Bearish Symmetrical Triangle
- Bearish Symmetrical Triangle
- Bullish Rectangle
- Double Top
- Double Top
- Triple Bottom
- Triple Bottom
- Triple Top
- Triple Top
- Все
- Все
- Покупка
- Продажа
- Все
- 1
- 2
- 3
- 4
- 5
Head and Shoulders
сформирован 10.06 в 23:26:25 (UTC+0)
сила сигнала 1 из 5
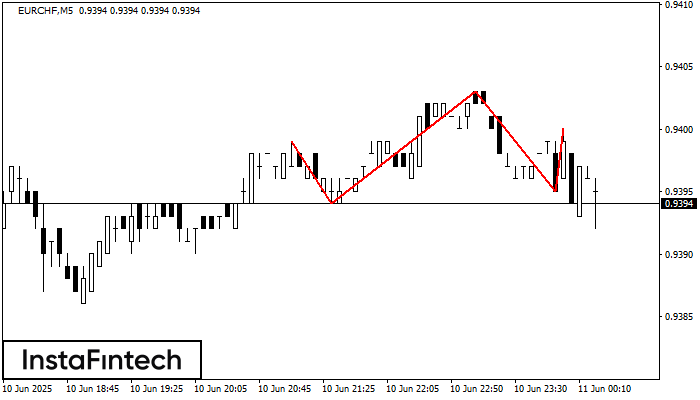
The technical pattern called Head and Shoulders has appeared on the chart of EURCHF M5. There are weighty reasons to suggest that the price will surpass the Neckline 0.9394/0.9395 after
The M5 and M15 time frames may have more false entry points.
Открыть график инструмента в новом окне
Bullish Symmetrical Triangle
сформирован 10.06 в 23:04:24 (UTC+0)
сила сигнала 1 из 5
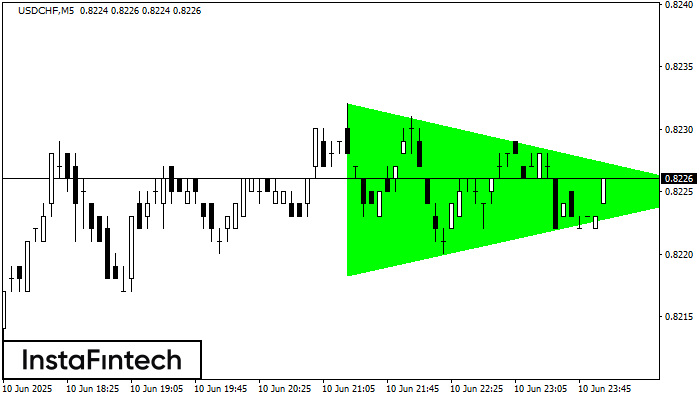
According to the chart of M5, USDCHF formed the Bullish Symmetrical Triangle pattern. The lower border of the pattern touches the coordinates 0.8218/0.8225 whereas the upper border goes across 0.8232/0.8225
The M5 and M15 time frames may have more false entry points.
Открыть график инструмента в новом окне
Bullish Symmetrical Triangle
сформирован 10.06 в 22:55:00 (UTC+0)
сила сигнала 1 из 5
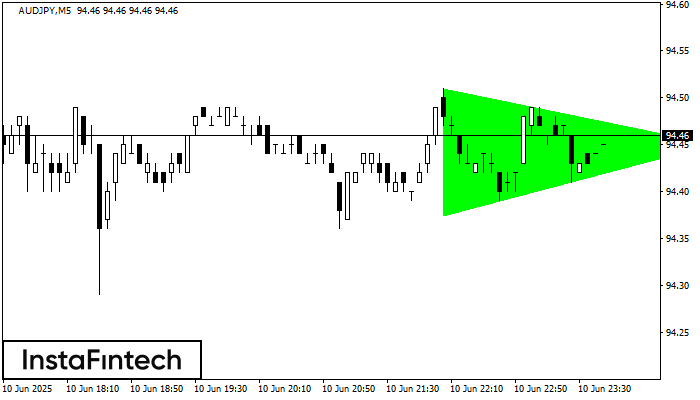
According to the chart of M5, AUDJPY formed the Bullish Symmetrical Triangle pattern. The lower border of the pattern touches the coordinates 94.37/94.45 whereas the upper border goes across 94.51/94.45
The M5 and M15 time frames may have more false entry points.
Открыть график инструмента в новом окне


