

Dolzarb patternlar

Бычий вымпел
сформирован 14.04 в 16:05:59 (UTC+0)
сила сигнала 1 из 5

Графическая фигура «Бычий вымпел» сформировалась по инструменту #AAPL на M5. Данный вид фигуры относится к типу продолжения тенденции. В случае если котировке удастся преодолеть максимум вымпела 212.82, то ожидается продолжение восходящего тренда к уровню 212.97.
Таймфреймы М5 и М15 могут иметь больше ложных точек входа.
- Все
- Все
- Bearish Rectangle
- Bearish Symmetrical Triangle
- Bearish Symmetrical Triangle
- Bullish Rectangle
- Double Top
- Double Top
- Triple Bottom
- Triple Bottom
- Triple Top
- Triple Top
- Все
- Все
- Покупка
- Продажа
- Все
- 1
- 2
- 3
- 4
- 5
Bearish Rectangle
сформирован 11.06 в 12:30:39 (UTC+0)
сила сигнала 2 из 5
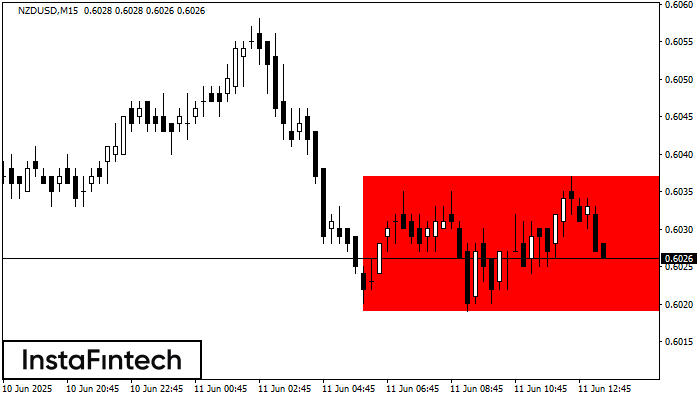
According to the chart of M15, NZDUSD formed the Bearish Rectangle which is a pattern of a trend continuation. The pattern is contained within the following borders: lower border 0.6019
The M5 and M15 time frames may have more false entry points.
Открыть график инструмента в новом окне
Double Top
сформирован 11.06 в 12:00:04 (UTC+0)
сила сигнала 4 из 5
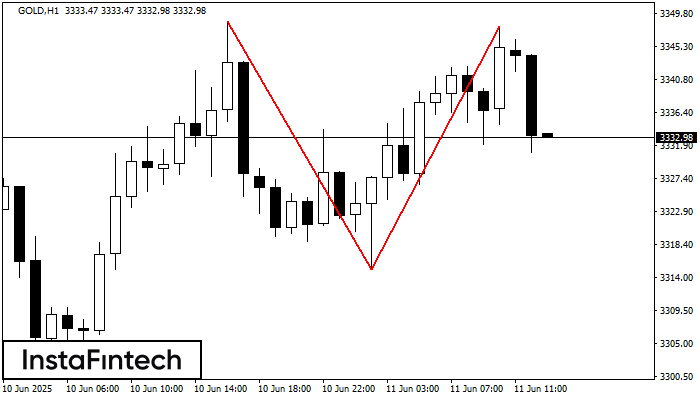
The Double Top pattern has been formed on GOLD H1. It signals that the trend has been changed from upwards to downwards. Probably, if the base of the pattern 3315.04
Открыть график инструмента в новом окне
Bullish Symmetrical Triangle
сформирован 11.06 в 11:35:34 (UTC+0)
сила сигнала 2 из 5
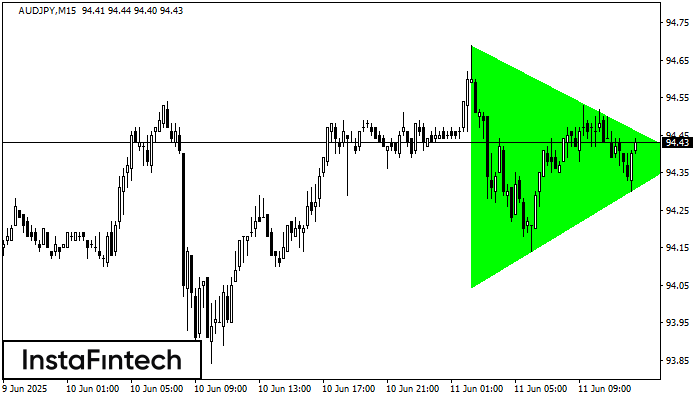
According to the chart of M15, AUDJPY formed the Bullish Symmetrical Triangle pattern, which signals the trend will continue. Description. The upper border of the pattern touches the coordinates 94.69/94.39
The M5 and M15 time frames may have more false entry points.
Открыть график инструмента в новом окне


