

Dolzarb patternlar

Медвежий симметричный треугольник
сформирован 11.04 в 10:00:19 (UTC+0)
сила сигнала 3 из 5
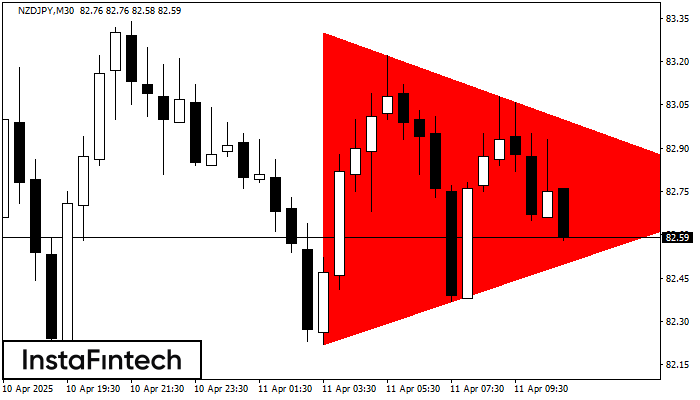
По NZDJPY M30 сформировалась фигура «Медвежий симметричный треугольник». Данная фигура сигнализирует нам о продолжении нисходящего тренда в случае пробоя нижней границы 82.22, где вероятная прибыль будет являться шириной текущей фигуры -108 пунктов.
Shuningdek ko'ring
- Все
- Все
- Bearish Rectangle
- Bearish Symmetrical Triangle
- Bearish Symmetrical Triangle
- Bullish Rectangle
- Double Top
- Double Top
- Triple Bottom
- Triple Bottom
- Triple Top
- Triple Top
- Все
- Все
- Покупка
- Продажа
- Все
- 1
- 2
- 3
- 4
- 5
Bearish Rectangle
сформирован 14.05 в 19:42:39 (UTC+0)
сила сигнала 1 из 5
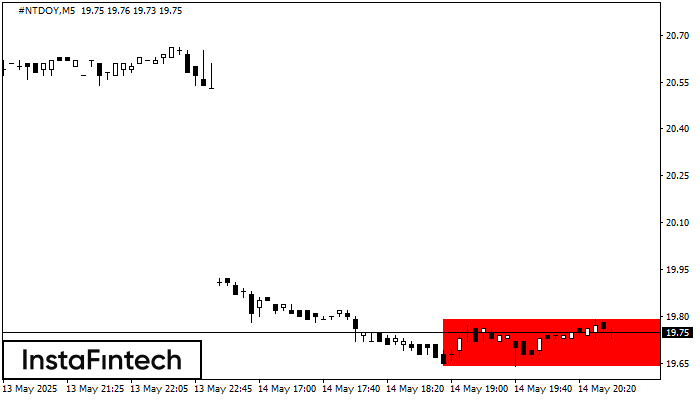
According to the chart of M5, #NTDOY formed the Bearish Rectangle. The pattern indicates a trend continuation. The upper border is 19.79, the lower border is 19.64. The signal means
The M5 and M15 time frames may have more false entry points.
Открыть график инструмента в новом окне
Bearish Rectangle
сформирован 14.05 в 19:42:36 (UTC+0)
сила сигнала 1 из 5
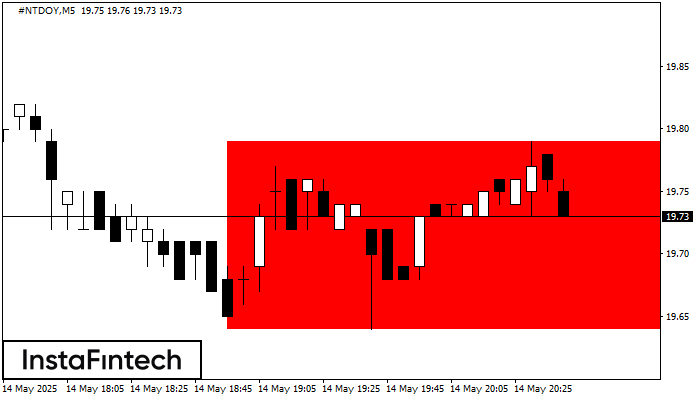
According to the chart of M5, #NTDOY formed the Bearish Rectangle. The pattern indicates a trend continuation. The upper border is 19.79, the lower border is 19.64. The signal means
The M5 and M15 time frames may have more false entry points.
Открыть график инструмента в новом окне
Head and Shoulders
сформирован 14.05 в 19:30:34 (UTC+0)
сила сигнала 1 из 5

The technical pattern called Head and Shoulders has appeared on the chart of GBPCHF M5. There are weighty reasons to suggest that the price will surpass the Neckline 1.1164/1.1166 after
The M5 and M15 time frames may have more false entry points.
Открыть график инструмента в новом окне


