

Dolzarb patternlar

Бычий симметричный треугольник
сформирован 08.04 в 08:31:09 (UTC+0)
сила сигнала 1 из 5
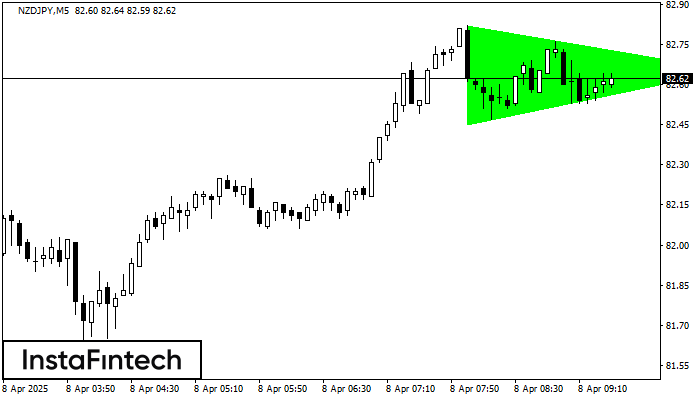
По NZDJPY на M5 фигура «Бычий симметричный треугольник». Характеристика: Фигура продолжения тренда; Координаты границ – верхняя 82.82, нижняя 82.45. Проекция ширины фигуры 37 пунктов. Прогноз: В случае пробоя верхней границы 82.82 цена, вероятнее всего, продолжит движение к 82.80.
Таймфреймы М5 и М15 могут иметь больше ложных точек входа.
Shuningdek ko'ring
- Все
- Все
- Bearish Rectangle
- Bearish Symmetrical Triangle
- Bearish Symmetrical Triangle
- Bullish Rectangle
- Double Top
- Double Top
- Triple Bottom
- Triple Bottom
- Triple Top
- Triple Top
- Все
- Все
- Покупка
- Продажа
- Все
- 1
- 2
- 3
- 4
- 5
Double Top
сформирован 12.05 в 22:00:17 (UTC+0)
сила сигнала 3 из 5
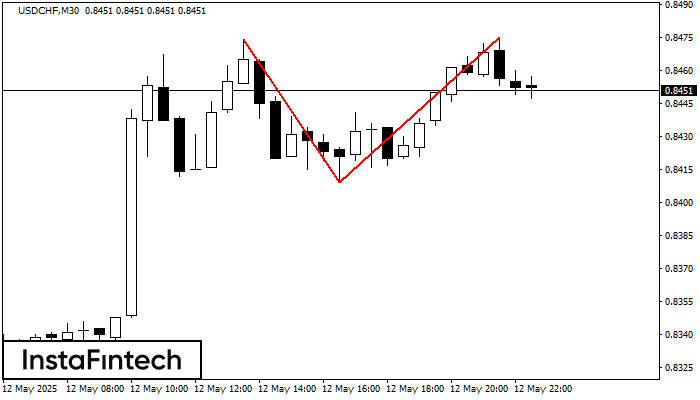
On the chart of USDCHF M30 the Double Top reversal pattern has been formed. Characteristics: the upper boundary 0.8475; the lower boundary 0.8409; the width of the pattern 66 points
Открыть график инструмента в новом окне
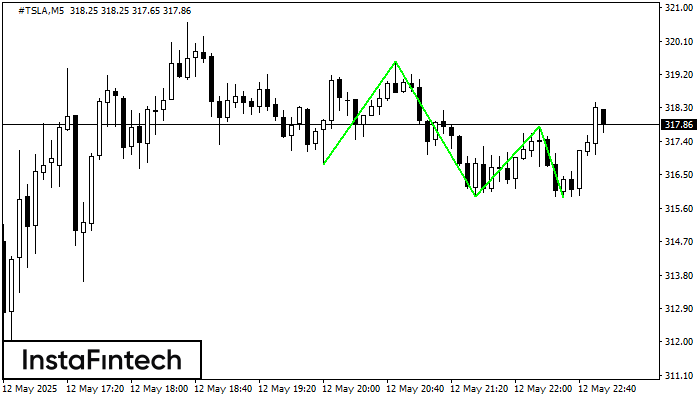
Triple Bottom
сформирован 12.05 в 21:55:25 (UTC+0)
сила сигнала 1 из 5

The Triple Bottom pattern has been formed on #TSLA M5. It has the following characteristics: resistance level 319.55/317.80; support level 316.79/315.89; the width is 276 points. In the event
The M5 and M15 time frames may have more false entry points.
Открыть график инструмента в новом окне
Triple Bottom
сформирован 12.05 в 21:55:11 (UTC+0)
сила сигнала 1 из 5
The Triple Bottom pattern has formed on the chart of #TSLA M5. Features of the pattern: The lower line of the pattern has coordinates 319.55 with the upper limit 319.55/317.80
The M5 and M15 time frames may have more false entry points.
Открыть график инструмента в новом окне


