

Dolzarb patternlar

Двойная вершина
сформирован 08.04 в 07:55:14 (UTC+0)
сила сигнала 1 из 5
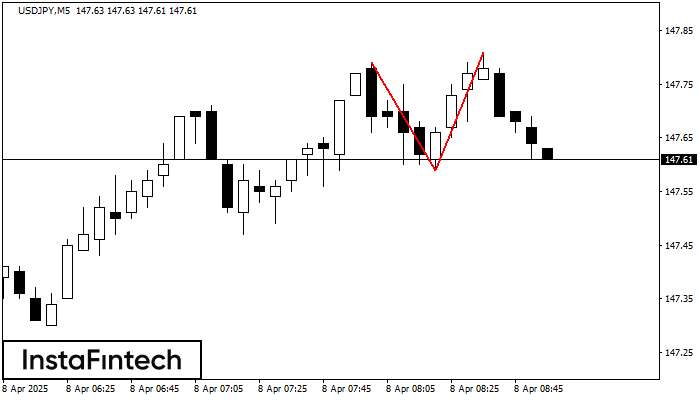
На торговом графике USDJPY M5 сформировалась разворотная фигура «Двойная вершина». Характеристика: Верхняя граница 147.81; Нижняя граница 147.59; Ширина фигуры 22 пунктов. Сигнал: Пробой нижней границы 147.59 приведет к дальнейшему нисходящему движению с перспективой хода к уровню 147.44.
Таймфреймы М5 и М15 могут иметь больше ложных точек входа.
- Все
- Все
- Bearish Rectangle
- Bearish Symmetrical Triangle
- Bearish Symmetrical Triangle
- Bullish Rectangle
- Double Top
- Double Top
- Triple Bottom
- Triple Bottom
- Triple Top
- Triple Top
- Все
- Все
- Покупка
- Продажа
- Все
- 1
- 2
- 3
- 4
- 5
Bullish Symmetrical Triangle
was formed on 23.05 at 08:47:46 (UTC+0)
signal strength 1 of 5
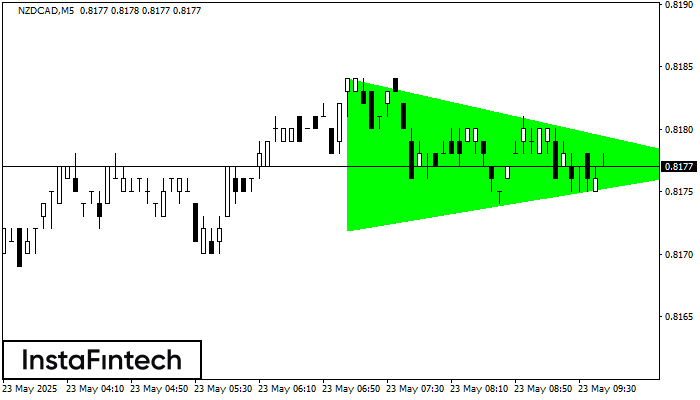
According to the chart of M5, NZDCAD formed the Bullish Symmetrical Triangle pattern, which signals the trend will continue. Description. The upper border of the pattern touches the coordinates 0.8184/0.8177
The M5 and M15 time frames may have more false entry points.
Open chart in a new window
Bullish Symmetrical Triangle
was formed on 23.05 at 08:41:38 (UTC+0)
signal strength 1 of 5
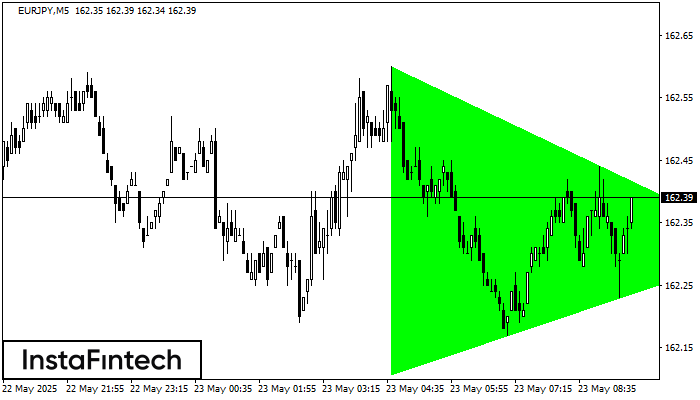
According to the chart of M5, EURJPY formed the Bullish Symmetrical Triangle pattern. Description: This is the pattern of a trend continuation. 162.60 and 162.11 are the coordinates
The M5 and M15 time frames may have more false entry points.
Open chart in a new window
Bearish Symmetrical Triangle
was formed on 23.05 at 08:32:20 (UTC+0)
signal strength 3 of 5
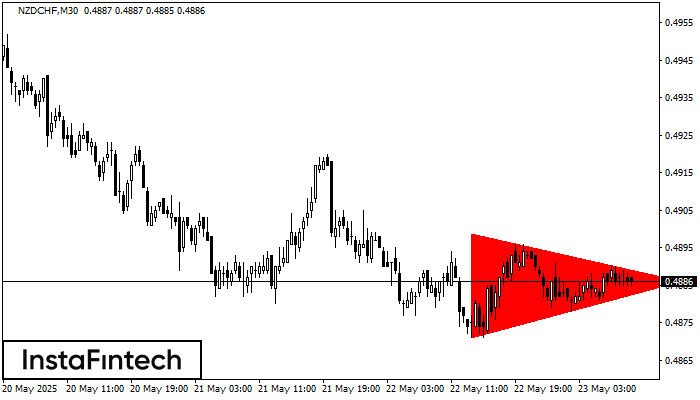
According to the chart of M30, NZDCHF formed the Bearish Symmetrical Triangle pattern. Description: The lower border is 0.4871/0.4886 and upper border is 0.4899/0.4886. The pattern width is measured
Open chart in a new window


