

Dolzarb patternlar

Двойная вершина
сформирован 07.04 в 09:09:57 (UTC+0)
сила сигнала 1 из 5
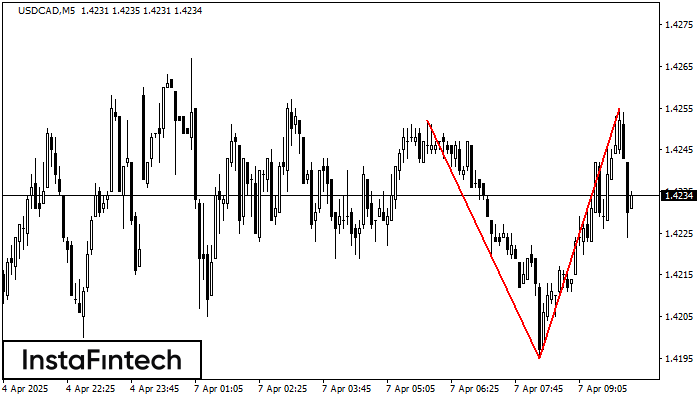
На торговом графике USDCAD M5 сформировалась разворотная фигура «Двойная вершина». Характеристика: Верхняя граница 1.4255; Нижняя граница 1.4195; Ширина фигуры 60 пунктов. Сигнал: Пробой нижней границы 1.4195 приведет к дальнейшему нисходящему движению с перспективой хода к уровню 1.4180.
Таймфреймы М5 и М15 могут иметь больше ложных точек входа.
Shuningdek ko'ring
- Все
- Все
- Bearish Rectangle
- Bearish Symmetrical Triangle
- Bearish Symmetrical Triangle
- Bullish Rectangle
- Double Top
- Double Top
- Triple Bottom
- Triple Bottom
- Triple Top
- Triple Top
- Все
- Все
- Покупка
- Продажа
- Все
- 1
- 2
- 3
- 4
- 5
Bearish Rectangle
was formed on 17.04 at 05:27:54 (UTC+0)
signal strength 1 of 5

According to the chart of M5, AUDUSD formed the Bearish Rectangle which is a pattern of a trend continuation. The pattern is contained within the following borders: lower border 0.6353
The M5 and M15 time frames may have more false entry points.
Open chart in a new window
Bullish Rectangle
was formed on 17.04 at 05:00:58 (UTC+0)
signal strength 3 of 5

According to the chart of M30, EURGBP formed the Bullish Rectangle. This type of a pattern indicates a trend continuation. It consists of two levels: resistance 0.8615 and support 0.8598
Open chart in a new window
Double Bottom
was formed on 17.04 at 04:15:46 (UTC+0)
signal strength 2 of 5

The Double Bottom pattern has been formed on EURCAD M15. Characteristics: the support level 1.5761; the resistance level 1.5828; the width of the pattern 67 points. If the resistance level
The M5 and M15 time frames may have more false entry points.
Open chart in a new window


