

Dolzarb patternlar

Медвежий вымпел
сформирован 07.04 в 00:00:21 (UTC+0)
сила сигнала 2 из 5
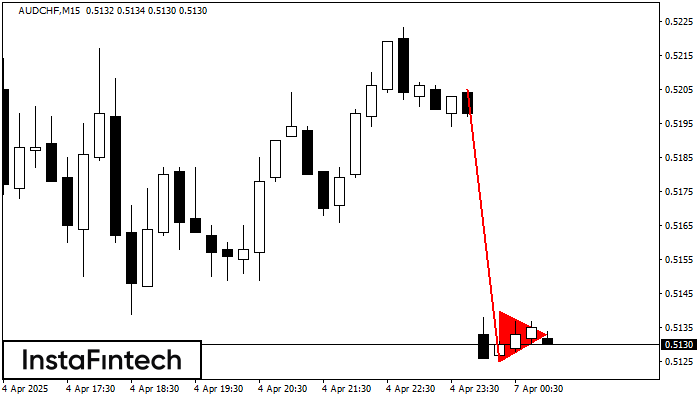
На графике AUDCHF M15 сформировалась фигура «Медвежий вымпел», которая сигнализирует о возможном продолжении тренда. Характеристика: основание фигуры имеет координаты 0.5125; проекция высоты флагштока равна 80 пунктов. В случае если цена преодолеет основание фигуры 0.5125, то ожидается продолжение нисходящего тренда на уровень 0.5102 пунктов.
Таймфреймы М5 и М15 могут иметь больше ложных точек входа.
- Все
- Все
- Bearish Rectangle
- Bearish Symmetrical Triangle
- Bearish Symmetrical Triangle
- Bullish Rectangle
- Double Top
- Double Top
- Triple Bottom
- Triple Bottom
- Triple Top
- Triple Top
- Все
- Все
- Покупка
- Продажа
- Все
- 1
- 2
- 3
- 4
- 5
Bearish Rectangle
сформирован 11.06 в 00:54:30 (UTC+0)
сила сигнала 1 из 5
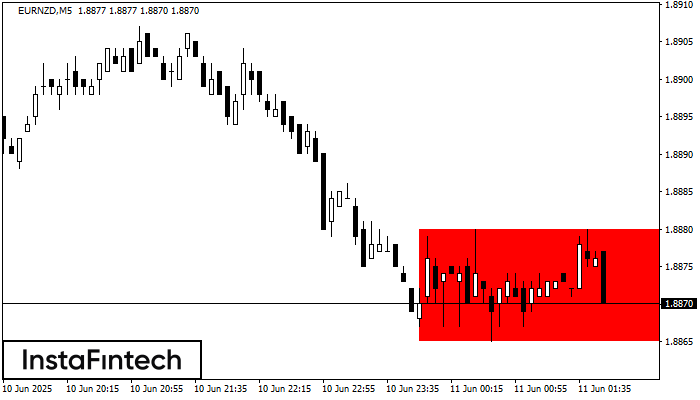
According to the chart of M5, EURNZD formed the Bearish Rectangle which is a pattern of a trend continuation. The pattern is contained within the following borders: lower border 1.8865
The M5 and M15 time frames may have more false entry points.
Открыть график инструмента в новом окне
Triple Top
сформирован 11.06 в 00:45:58 (UTC+0)
сила сигнала 1 из 5
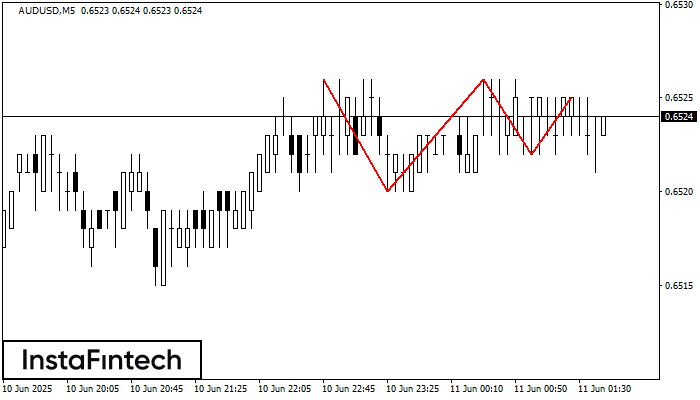
The Triple Top pattern has formed on the chart of the AUDUSD M5. Features of the pattern: borders have an ascending angle; the lower line of the pattern
The M5 and M15 time frames may have more false entry points.
Открыть график инструмента в новом окне
Bullish Symmetrical Triangle
сформирован 11.06 в 00:21:28 (UTC+0)
сила сигнала 1 из 5
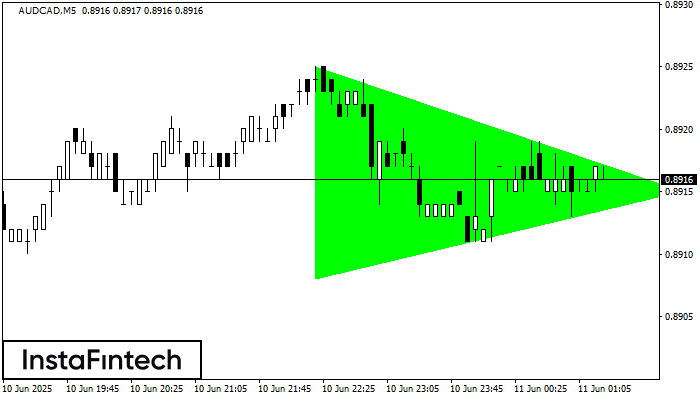
According to the chart of M5, AUDCAD formed the Bullish Symmetrical Triangle pattern. Description: This is the pattern of a trend continuation. 0.8925 and 0.8908 are the coordinates
The M5 and M15 time frames may have more false entry points.
Открыть график инструмента в новом окне


