

Dolzarb patternlar

Прямоугольник
сформирован 04.04 в 21:58:39 (UTC+0)
сила сигнала 1 из 5

По торговому инструменту EURUSD на M5 сформировалась фигура продолжения тренда - «Прямоугольник». Фигура имеет границы: Нижняя 1.0924; Верхняя 1.0967. В случае пробоя нижней границы вероятно дальнейшее движение в сторону тренда.
Таймфреймы М5 и М15 могут иметь больше ложных точек входа.
Shuningdek ko'ring
- Все
- Все
- Bearish Rectangle
- Bearish Symmetrical Triangle
- Bearish Symmetrical Triangle
- Bullish Rectangle
- Double Top
- Double Top
- Triple Bottom
- Triple Bottom
- Triple Top
- Triple Top
- Все
- Все
- Покупка
- Продажа
- Все
- 1
- 2
- 3
- 4
- 5
Double Bottom
сформирован 11.04 в 15:25:04 (UTC+0)
сила сигнала 1 из 5
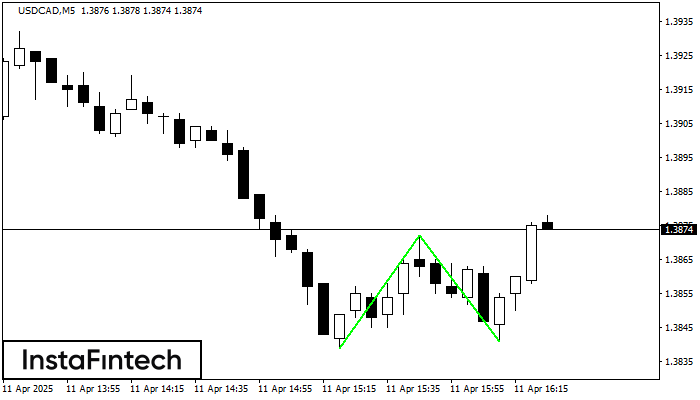
The Double Bottom pattern has been formed on USDCAD M5. Characteristics: the support level 1.3839; the resistance level 1.3872; the width of the pattern 33 points. If the resistance level
The M5 and M15 time frames may have more false entry points.
Открыть график инструмента в новом окне
Bearish Rectangle
сформирован 11.04 в 15:08:43 (UTC+0)
сила сигнала 4 из 5
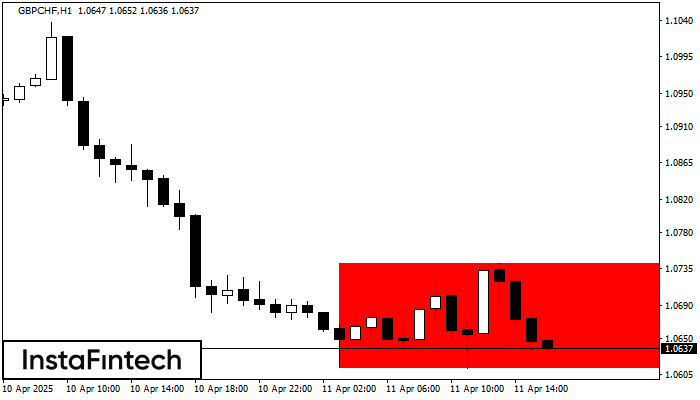
According to the chart of H1, GBPCHF formed the Bearish Rectangle. The pattern indicates a trend continuation. The upper border is 1.0742, the lower border is 1.0613. The signal means
Открыть график инструмента в новом окне
Bearish Rectangle
сформирован 11.04 в 15:02:18 (UTC+0)
сила сигнала 3 из 5
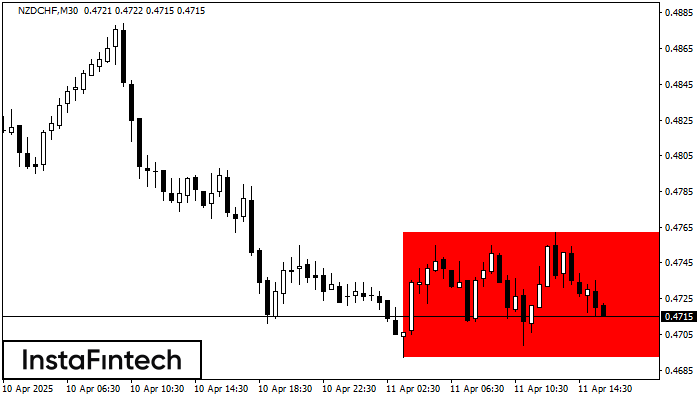
According to the chart of M30, NZDCHF formed the Bearish Rectangle. The pattern indicates a trend continuation. The upper border is 0.4762, the lower border is 0.4692. The signal means
Открыть график инструмента в новом окне


