

Dolzarb patternlar

Прямоугольник
сформирован 04.04 в 04:21:33 (UTC+0)
сила сигнала 2 из 5
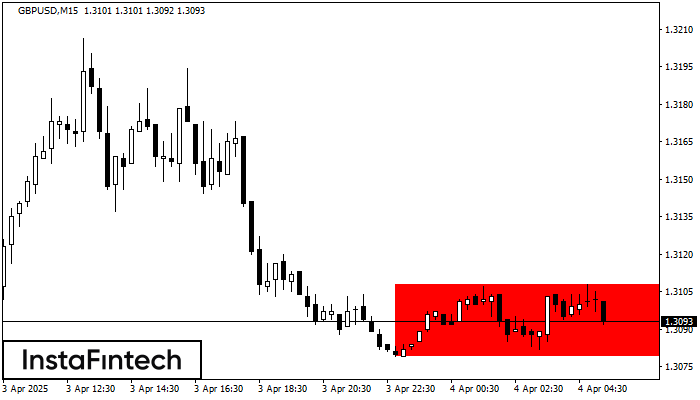
Сформирована фигура «Прямоугольник» на графике GBPUSD M15. Тип фигуры: Продолжение тренда; Границы: Верхняя 1.3108, Нижняя 1.3079; Сигнал: позиция на продажу открывается после фиксации цены ниже границы прямоугольника 1.3079.
Таймфреймы М5 и М15 могут иметь больше ложных точек входа.
- Все
- Все
- Bearish Rectangle
- Bearish Symmetrical Triangle
- Bearish Symmetrical Triangle
- Bullish Rectangle
- Double Top
- Double Top
- Triple Bottom
- Triple Bottom
- Triple Top
- Triple Top
- Все
- Все
- Покупка
- Продажа
- Все
- 1
- 2
- 3
- 4
- 5
Double Top
was formed on 06.06 at 16:55:00 (UTC+0)
signal strength 1 of 5
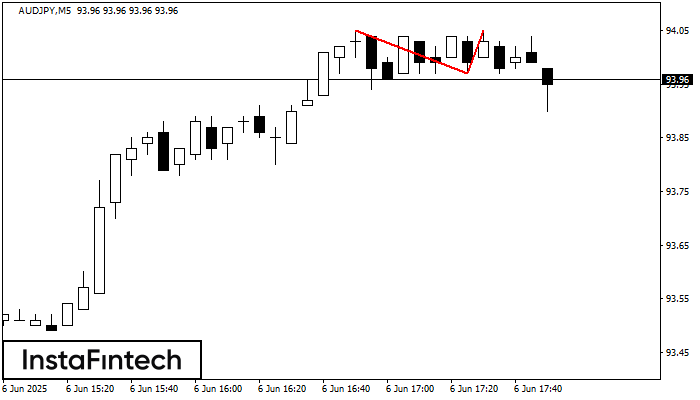
The Double Top pattern has been formed on AUDJPY M5. It signals that the trend has been changed from upwards to downwards. Probably, if the base of the pattern 93.97
The M5 and M15 time frames may have more false entry points.
Open chart in a new window
Bearish Symmetrical Triangle
was formed on 06.06 at 16:28:47 (UTC+0)
signal strength 1 of 5
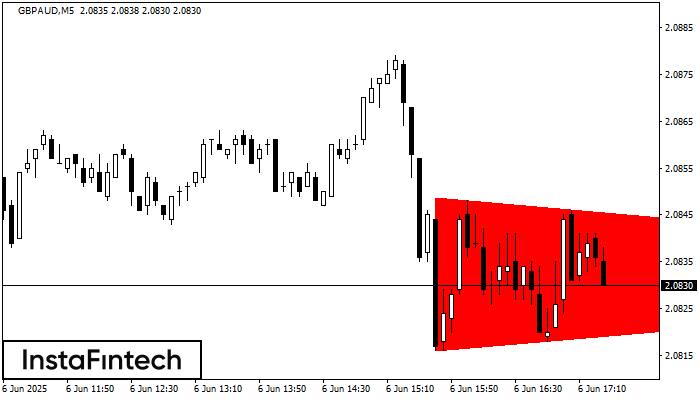
According to the chart of M5, GBPAUD formed the Bearish Symmetrical Triangle pattern. Trading recommendations: A breach of the lower border 2.0816 is likely to encourage a continuation
The M5 and M15 time frames may have more false entry points.
Open chart in a new window
Bullish pennant
was formed on 06.06 at 16:08:39 (UTC+0)
signal strength 1 of 5
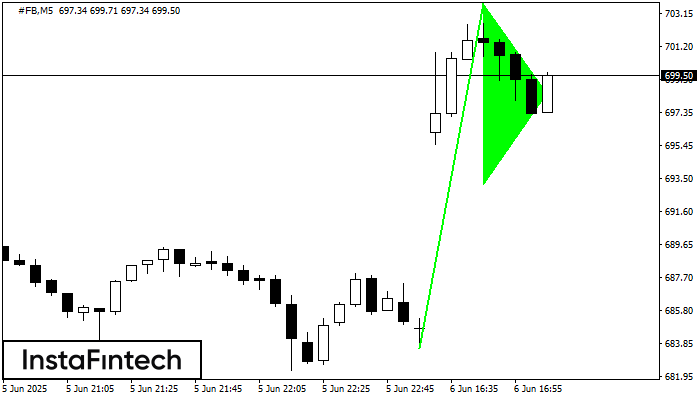
The Bullish pennant pattern is formed on the #FB M5 chart. It is a type of the continuation pattern. Supposedly, in case the price is fixed above the pennant’s high
The M5 and M15 time frames may have more false entry points.
Open chart in a new window


