

Dolzarb patternlar

Тройное дно
сформирован 03.04 в 01:24:55 (UTC+0)
сила сигнала 1 из 5
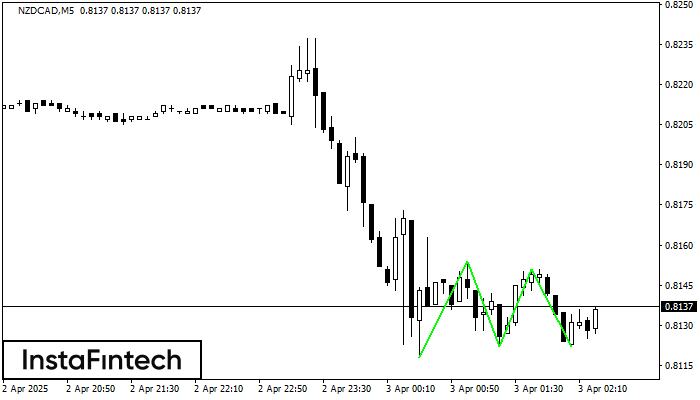
Сформирована фигура «Тройное дно» по торговому инструменту NZDCAD на M5. Фигура сигнализирует об изменении тенденции с нисходящей на восходящую в случае пробоя верхней границы 0.8151.
Таймфреймы М5 и М15 могут иметь больше ложных точек входа.
- Все
- Все
- Bearish Rectangle
- Bearish Symmetrical Triangle
- Bearish Symmetrical Triangle
- Bullish Rectangle
- Double Top
- Double Top
- Triple Bottom
- Triple Bottom
- Triple Top
- Triple Top
- Все
- Все
- Покупка
- Продажа
- Все
- 1
- 2
- 3
- 4
- 5
Double Top
сформирован 01.06 в 01:00:35 (UTC+0)
сила сигнала 3 из 5

The Double Top reversal pattern has been formed on #Bitcoin M30. Characteristics: the upper boundary 104800.13; the lower boundary 104215.56; the width of the pattern is 64024 points. Sell trades
Открыть график инструмента в новом окне
Bullish Rectangle
сформирован 31.05 в 19:15:46 (UTC+0)
сила сигнала 1 из 5

According to the chart of M5, #Bitcoin formed the Bullish Rectangle which is a pattern of a trend continuation. The pattern is contained within the following borders: the lower border
The M5 and M15 time frames may have more false entry points.
Открыть график инструмента в новом окне
Double Bottom
сформирован 31.05 в 13:20:01 (UTC+0)
сила сигнала 1 из 5

The Double Bottom pattern has been formed on #Bitcoin M5. Characteristics: the support level 103250.25; the resistance level 103385.09; the width of the pattern 13484 points. If the resistance level
The M5 and M15 time frames may have more false entry points.
Открыть график инструмента в новом окне


