

Dolzarb patternlar

Прямоугольник
сформирован 02.04 в 19:45:31 (UTC+0)
сила сигнала 1 из 5
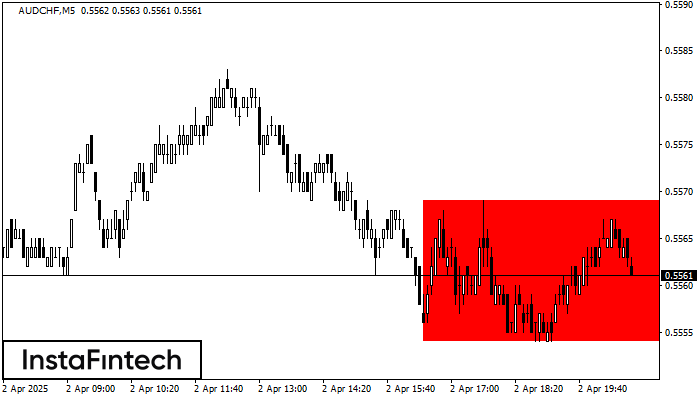
Сформирована фигура «Прямоугольник» на графике AUDCHF M5. Тип фигуры: Продолжение тренда; Границы: Верхняя 0.5569, Нижняя 0.5554; Сигнал: позиция на продажу открывается после фиксации цены ниже границы прямоугольника 0.5554.
Таймфреймы М5 и М15 могут иметь больше ложных точек входа.
- Все
- Все
- Bearish Rectangle
- Bearish Symmetrical Triangle
- Bearish Symmetrical Triangle
- Bullish Rectangle
- Double Top
- Double Top
- Triple Bottom
- Triple Bottom
- Triple Top
- Triple Top
- Все
- Все
- Покупка
- Продажа
- Все
- 1
- 2
- 3
- 4
- 5
Double Top
сформирован 06.06 в 05:05:28 (UTC+0)
сила сигнала 1 из 5
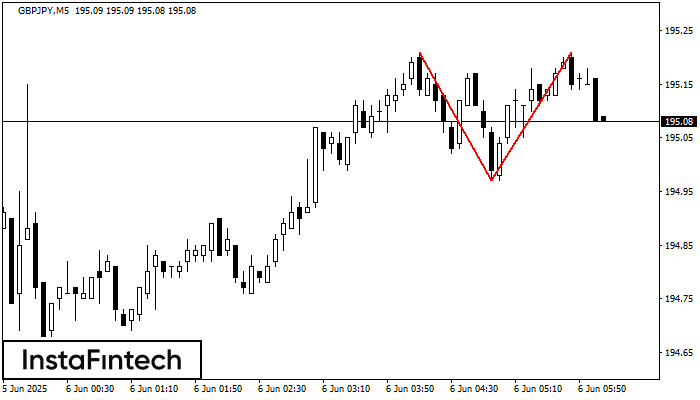
The Double Top reversal pattern has been formed on GBPJPY M5. Characteristics: the upper boundary 195.21; the lower boundary 194.97; the width of the pattern is 24 points. Sell trades
The M5 and M15 time frames may have more false entry points.
Открыть график инструмента в новом окне
Head and Shoulders
сформирован 06.06 в 05:01:27 (UTC+0)
сила сигнала 4 из 5
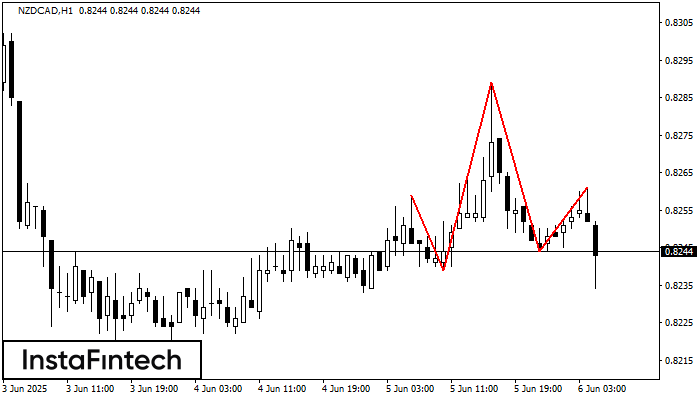
The technical pattern called Head and Shoulders has appeared on the chart of NZDCAD H1. There are weighty reasons to suggest that the price will surpass the Neckline 0.8239/0.8244 after
Открыть график инструмента в новом окне
Inverse Head and Shoulder
сформирован 06.06 в 05:00:19 (UTC+0)
сила сигнала 4 из 5
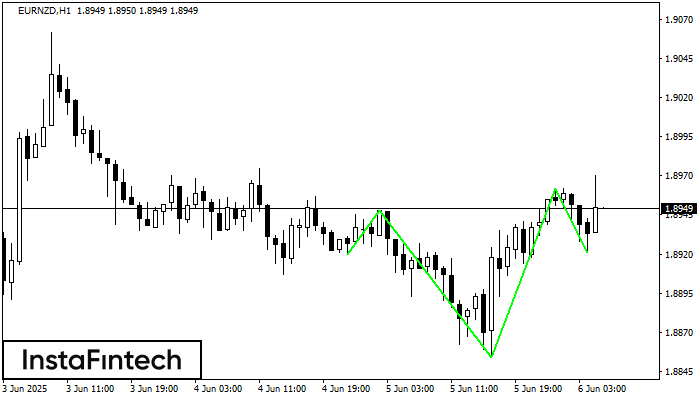
According to H1, EURNZD is shaping the technical pattern – the Inverse Head and Shoulder. In case the Neckline 1.8948/1.8962 is broken out, the instrument is likely to move toward
Открыть график инструмента в новом окне


