

Dolzarb patternlar

Двойное дно
сформирован 02.04 в 11:00:06 (UTC+0)
сила сигнала 4 из 5
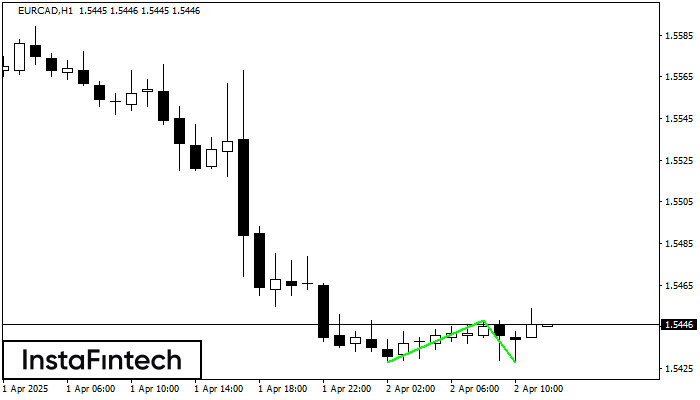
Сформирована фигура «Двойное дно» на графике EURCAD H1. Верхняя граница 1.5448; Нижняя граница 1.5428; Ширина фигуры 20 пунктов. В случае пробоя верхней границы 1.5448 можно будет прогнозировать изменение тенденции, где ширина фигуры и будет являться расстоянием предположительного Тейк Профита.
- Все
- Все
- Bearish Rectangle
- Bearish Symmetrical Triangle
- Bearish Symmetrical Triangle
- Bullish Rectangle
- Double Top
- Double Top
- Triple Bottom
- Triple Bottom
- Triple Top
- Triple Top
- Все
- Все
- Покупка
- Продажа
- Все
- 1
- 2
- 3
- 4
- 5
Triple Top
сформирован 13.06 в 19:10:43 (UTC+0)
сила сигнала 1 из 5
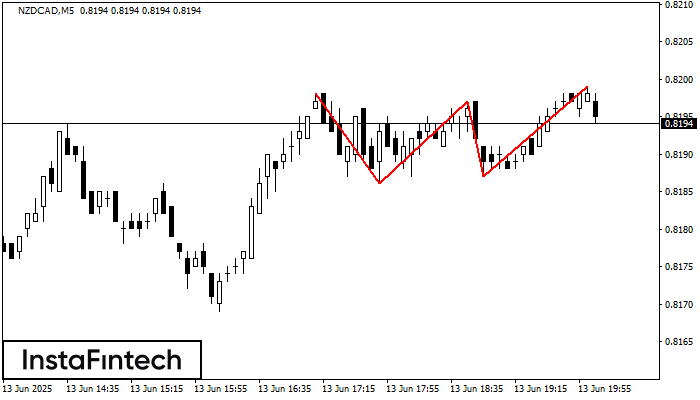
The Triple Top pattern has formed on the chart of the NZDCAD M5 trading instrument. It is a reversal pattern featuring the following characteristics: resistance level -1, support level -1
The M5 and M15 time frames may have more false entry points.
Открыть график инструмента в новом окне
Triple Bottom
сформирован 13.06 в 19:06:15 (UTC+0)
сила сигнала 1 из 5
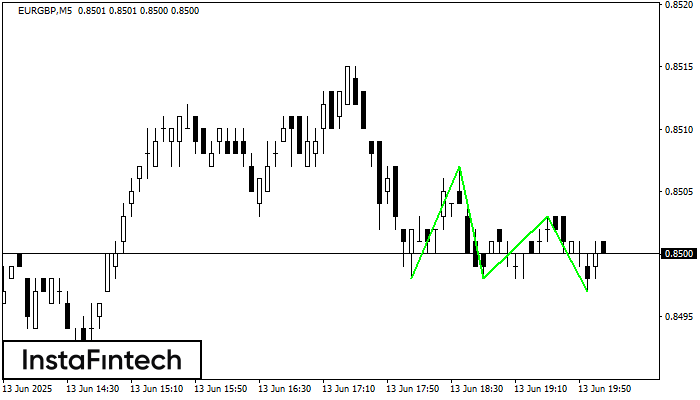
The Triple Bottom pattern has formed on the chart of EURGBP M5. Features of the pattern: The lower line of the pattern has coordinates 0.8507 with the upper limit 0.8507/0.8503
The M5 and M15 time frames may have more false entry points.
Открыть график инструмента в новом окне
Double Top
сформирован 13.06 в 19:05:29 (UTC+0)
сила сигнала 1 из 5
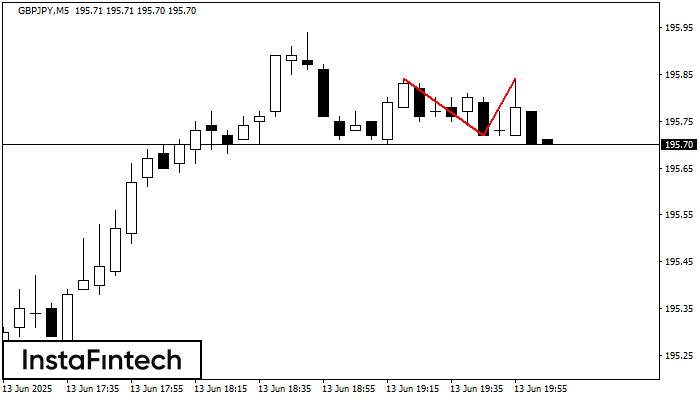
The Double Top reversal pattern has been formed on GBPJPY M5. Characteristics: the upper boundary 195.84; the lower boundary 195.72; the width of the pattern is 12 points. Sell trades
The M5 and M15 time frames may have more false entry points.
Открыть график инструмента в новом окне


