

Dolzarb patternlar

Прямоугольник
сформирован 02.04 в 02:16:17 (UTC+0)
сила сигнала 1 из 5
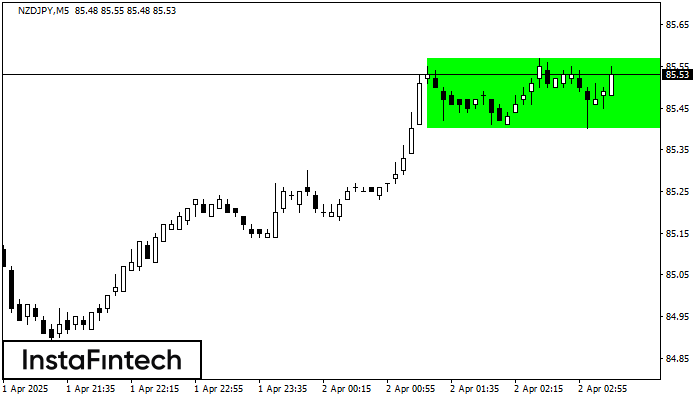
По торговому инструменту NZDJPY на M5 сформировалась фигура продолжения тренда - «Прямоугольник». Фигура имеет границы: Нижняя 85.40; Верхняя 85.57. В случае пробоя верхней границы вероятно дальнейшее движение в сторону тренда.
Таймфреймы М5 и М15 могут иметь больше ложных точек входа.
- Все
- Все
- Bearish Rectangle
- Bearish Symmetrical Triangle
- Bearish Symmetrical Triangle
- Bullish Rectangle
- Double Top
- Double Top
- Triple Bottom
- Triple Bottom
- Triple Top
- Triple Top
- Все
- Все
- Покупка
- Продажа
- Все
- 1
- 2
- 3
- 4
- 5
Bullish Symmetrical Triangle
сформирован 10.06 в 13:20:53 (UTC+0)
сила сигнала 1 из 5
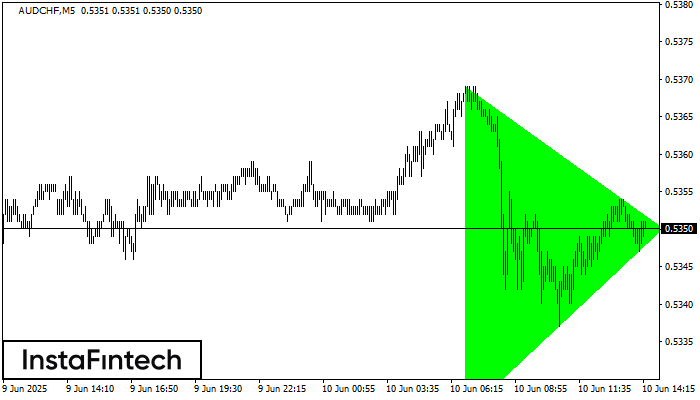
According to the chart of M5, AUDCHF formed the Bullish Symmetrical Triangle pattern. The lower border of the pattern touches the coordinates 0.5325/0.5350 whereas the upper border goes across 0.5369/0.5350
The M5 and M15 time frames may have more false entry points.
Открыть график инструмента в новом окне
Triple Top
сформирован 10.06 в 12:59:46 (UTC+0)
сила сигнала 1 из 5
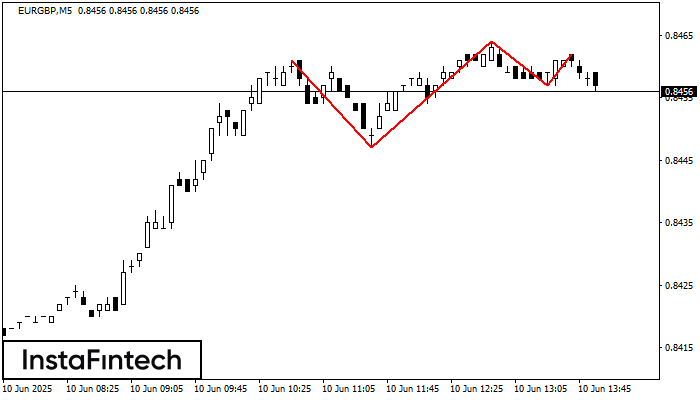
The Triple Top pattern has formed on the chart of the EURGBP M5. Features of the pattern: borders have an ascending angle; the lower line of the pattern
The M5 and M15 time frames may have more false entry points.
Открыть график инструмента в новом окне
Double Bottom
сформирован 10.06 в 12:00:33 (UTC+0)
сила сигнала 2 из 5
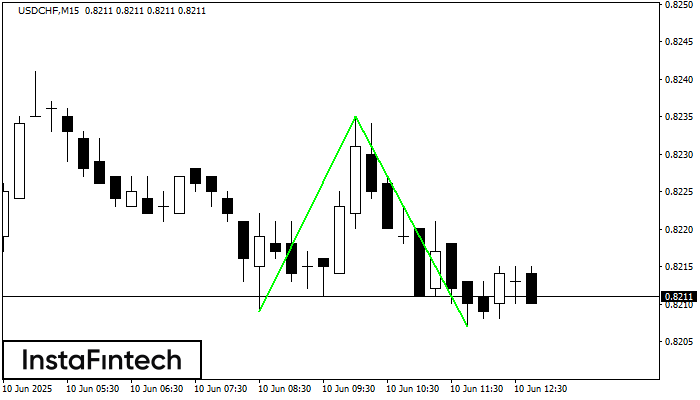
The Double Bottom pattern has been formed on USDCHF M15; the upper boundary is 0.8235; the lower boundary is 0.8207. The width of the pattern is 26 points. In case
The M5 and M15 time frames may have more false entry points.
Открыть график инструмента в новом окне


