

Dolzarb patternlar

Двойное дно
сформирован 01.04 в 16:44:59 (UTC+0)
сила сигнала 2 из 5
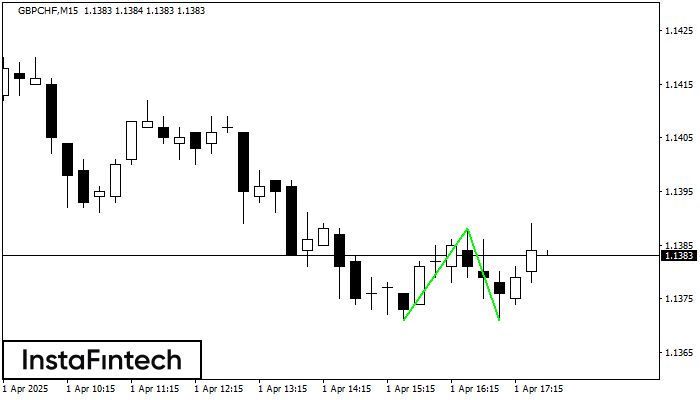
Сформирована фигура «Двойное дно» на графике GBPCHF M15. Характеристика: Уровень поддержки 1.1371; Уровень сопротивления 1.1388; Ширина фигуры 17 пунктов. В случае пробоя уровня сопротивления можно будет прогнозировать изменение тенденции, где первая точка фиксации прибыли находится на расстоянии 17 пунктов.
Таймфреймы М5 и М15 могут иметь больше ложных точек входа.
- Все
- Все
- Bearish Rectangle
- Bearish Symmetrical Triangle
- Bearish Symmetrical Triangle
- Bullish Rectangle
- Double Top
- Double Top
- Triple Bottom
- Triple Bottom
- Triple Top
- Triple Top
- Все
- Все
- Покупка
- Продажа
- Все
- 1
- 2
- 3
- 4
- 5
Triple Top
сформирован 10.06 в 02:10:31 (UTC+0)
сила сигнала 1 из 5
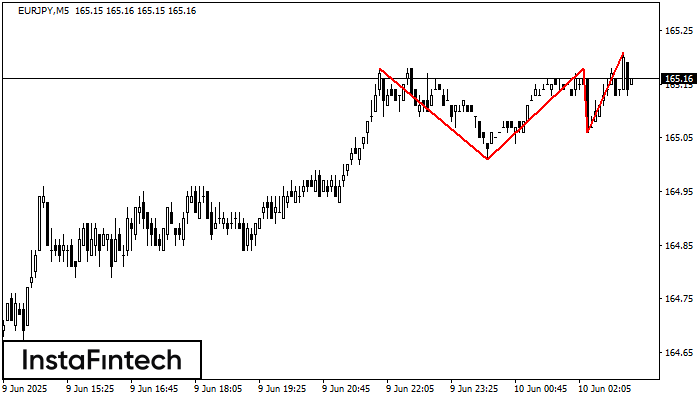
The Triple Top pattern has formed on the chart of the EURJPY M5 trading instrument. It is a reversal pattern featuring the following characteristics: resistance level -3, support level -5
The M5 and M15 time frames may have more false entry points.
Открыть график инструмента в новом окне
Bullish Symmetrical Triangle
сформирован 10.06 в 01:45:04 (UTC+0)
сила сигнала 1 из 5
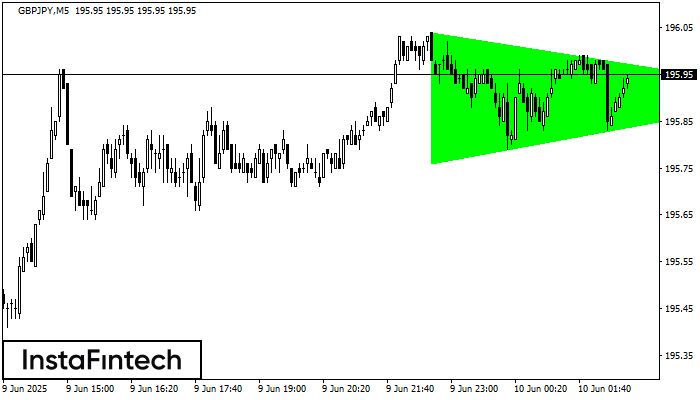
According to the chart of M5, GBPJPY formed the Bullish Symmetrical Triangle pattern. Description: This is the pattern of a trend continuation. 196.04 and 195.76 are the coordinates
The M5 and M15 time frames may have more false entry points.
Открыть график инструмента в новом окне
Bullish Symmetrical Triangle
сформирован 10.06 в 01:36:31 (UTC+0)
сила сигнала 1 из 5
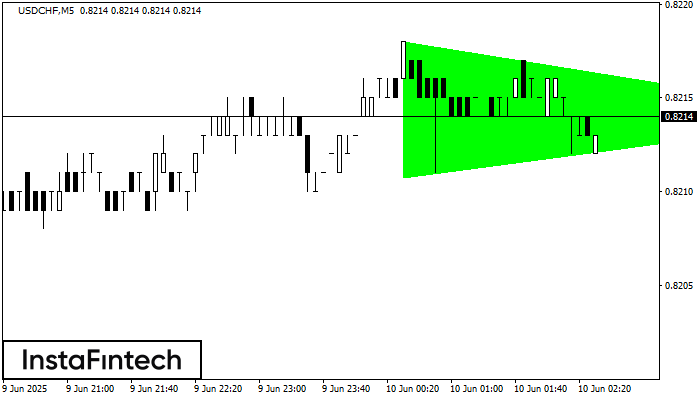
According to the chart of M5, USDCHF formed the Bullish Symmetrical Triangle pattern. The lower border of the pattern touches the coordinates 0.8211/0.8214 whereas the upper border goes across 0.8218/0.8214
The M5 and M15 time frames may have more false entry points.
Открыть график инструмента в новом окне


