

Dolzarb patternlar

Прямоугольник
сформирован 01.04 в 16:24:56 (UTC+0)
сила сигнала 1 из 5
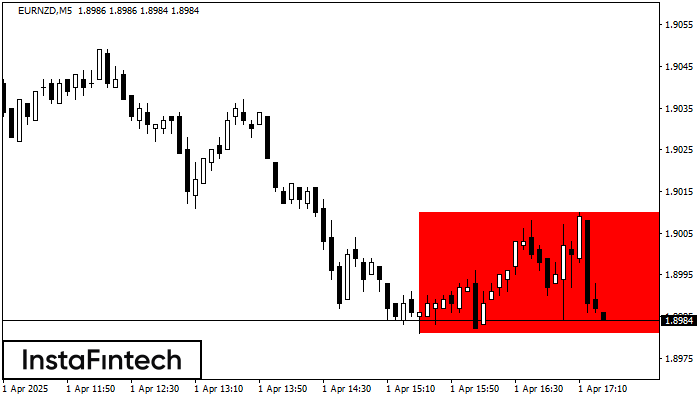
Сформирована фигура «Прямоугольник» на графике EURNZD M5. Тип фигуры: Продолжение тренда; Границы: Верхняя 1.9010, Нижняя 1.8981; Сигнал: позиция на продажу открывается после фиксации цены ниже границы прямоугольника 1.8981.
Таймфреймы М5 и М15 могут иметь больше ложных точек входа.
Shuningdek ko'ring
- Все
- Все
- Bearish Rectangle
- Bearish Symmetrical Triangle
- Bearish Symmetrical Triangle
- Bullish Rectangle
- Double Top
- Double Top
- Triple Bottom
- Triple Bottom
- Triple Top
- Triple Top
- Все
- Все
- Покупка
- Продажа
- Все
- 1
- 2
- 3
- 4
- 5
Triple Bottom
сформирован 13.06 в 22:45:28 (UTC+0)
сила сигнала 1 из 5

The Triple Bottom pattern has formed on the chart of AUDCHF M5. Features of the pattern: The lower line of the pattern has coordinates 0.5269 with the upper limit 0.5269/0.5268
The M5 and M15 time frames may have more false entry points.
Открыть график инструмента в новом окне
Bullish Symmetrical Triangle
сформирован 13.06 в 22:20:49 (UTC+0)
сила сигнала 1 из 5

According to the chart of M5, GBPAUD formed the Bullish Symmetrical Triangle pattern, which signals the trend will continue. Description. The upper border of the pattern touches the coordinates 2.0911/2.0896
The M5 and M15 time frames may have more false entry points.
Открыть график инструмента в новом окне
Bearish Symmetrical Triangle
сформирован 13.06 в 21:35:35 (UTC+0)
сила сигнала 1 из 5

According to the chart of M5, #TSLA formed the Bearish Symmetrical Triangle pattern. Trading recommendations: A breach of the lower border 313.81 is likely to encourage a continuation
The M5 and M15 time frames may have more false entry points.
Открыть график инструмента в новом окне


