

Dolzarb patternlar

Двойная вершина
сформирован 01.04 в 13:50:01 (UTC+0)
сила сигнала 1 из 5
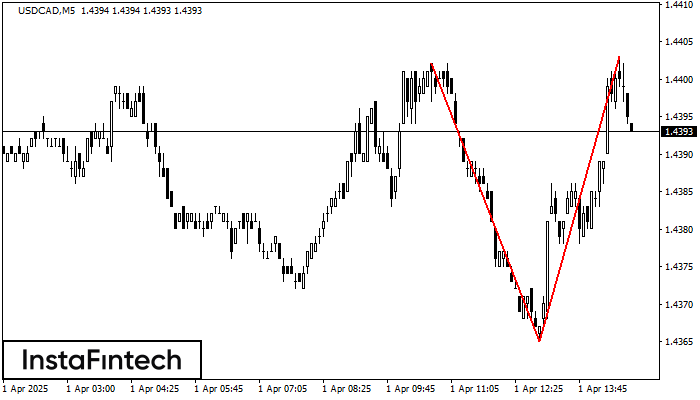
На торговом графике USDCAD M5 сформировалась разворотная фигура «Двойная вершина». Характеристика: Верхняя граница 1.4403; Нижняя граница 1.4365; Ширина фигуры 38 пунктов. Сигнал: Пробой нижней границы 1.4365 приведет к дальнейшему нисходящему движению с перспективой хода к уровню 1.4350.
Таймфреймы М5 и М15 могут иметь больше ложных точек входа.
- Все
- Все
- Bearish Rectangle
- Bearish Symmetrical Triangle
- Bearish Symmetrical Triangle
- Bullish Rectangle
- Double Top
- Double Top
- Triple Bottom
- Triple Bottom
- Triple Top
- Triple Top
- Все
- Все
- Покупка
- Продажа
- Все
- 1
- 2
- 3
- 4
- 5
Double Top
сформирован 28.05 в 12:45:36 (UTC+0)
сила сигнала 2 из 5
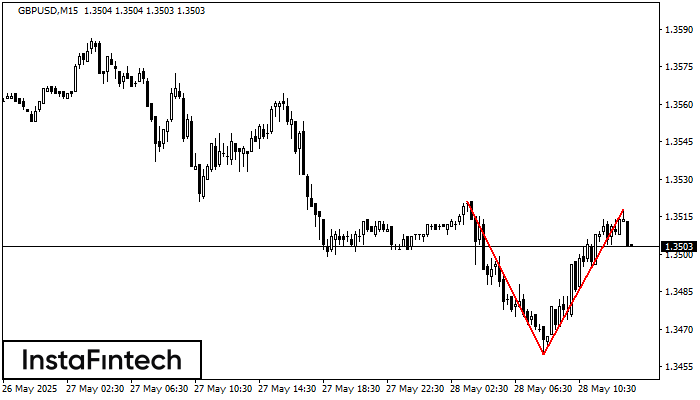
On the chart of GBPUSD M15 the Double Top reversal pattern has been formed. Characteristics: the upper boundary 1.3518; the lower boundary 1.3460; the width of the pattern 58 points
The M5 and M15 time frames may have more false entry points.
Открыть график инструмента в новом окне
Triple Top
сформирован 28.05 в 12:00:34 (UTC+0)
сила сигнала 2 из 5
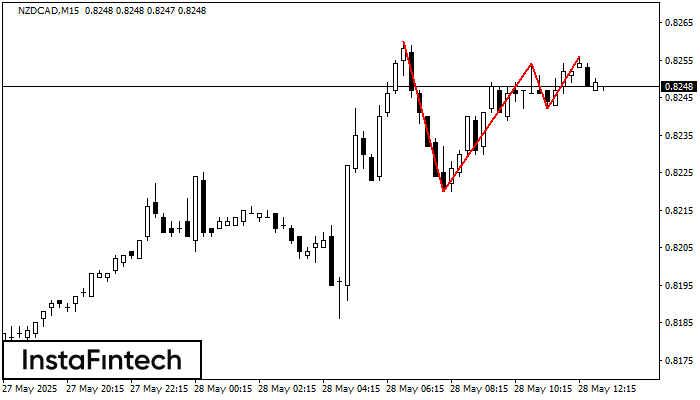
The Triple Top pattern has formed on the chart of the NZDCAD M15 trading instrument. It is a reversal pattern featuring the following characteristics: resistance level 4, support level -22
The M5 and M15 time frames may have more false entry points.
Открыть график инструмента в новом окне
Bullish Rectangle
сформирован 28.05 в 11:56:01 (UTC+0)
сила сигнала 1 из 5
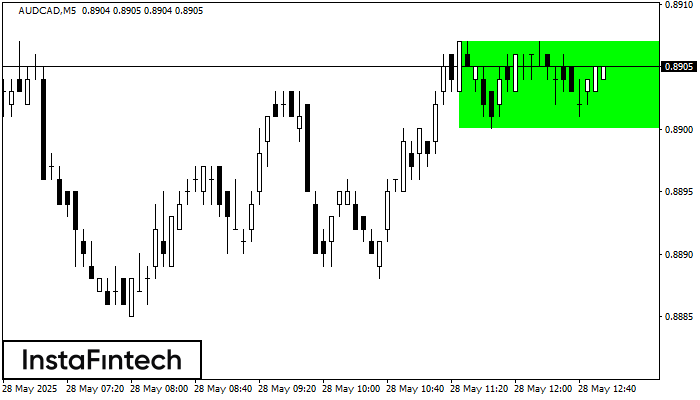
According to the chart of M5, AUDCAD formed the Bullish Rectangle. The pattern indicates a trend continuation. The upper border is 0.8907, the lower border is 0.8900. The signal means
The M5 and M15 time frames may have more false entry points.
Открыть график инструмента в новом окне


