

Dolzarb patternlar

Двойная вершина
сформирован 01.04 в 00:06:09 (UTC+0)
сила сигнала 1 из 5
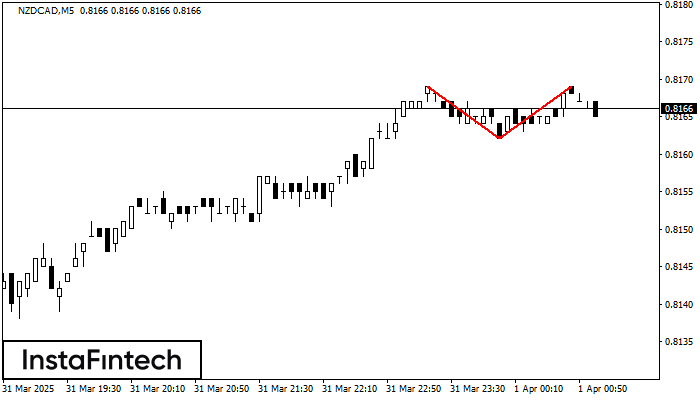
По торговому инструменту NZDCAD на M5 сформировалась фигура «Двойная вершина», которая сигнализирует нам об изменении тенденции с восходящей на нисходящую. Вероятно, что, в случае пробоя основания фигуры 0.8162, возможно дальнейшее нисходящее движение.
Таймфреймы М5 и М15 могут иметь больше ложных точек входа.
- Все
- Все
- Bearish Rectangle
- Bearish Symmetrical Triangle
- Bearish Symmetrical Triangle
- Bullish Rectangle
- Double Top
- Double Top
- Triple Bottom
- Triple Bottom
- Triple Top
- Triple Top
- Все
- Все
- Покупка
- Продажа
- Все
- 1
- 2
- 3
- 4
- 5
Triple Bottom
сформирован 08.04 в 02:15:19 (UTC+0)
сила сигнала 2 из 5
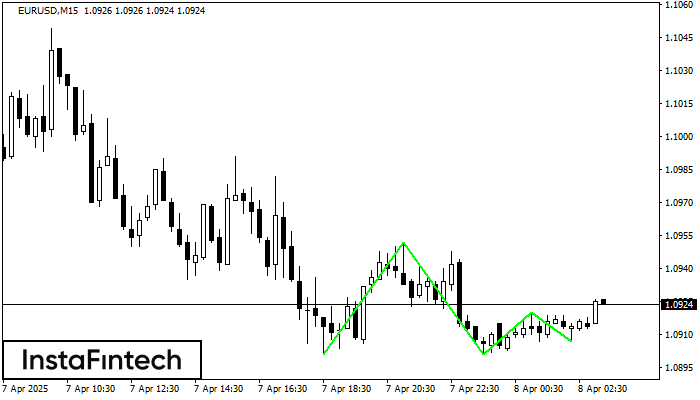
The Triple Bottom pattern has been formed on EURUSD M15. It has the following characteristics: resistance level 1.0952/1.0920; support level 1.0901/1.0907; the width is 51 points. In the event
The M5 and M15 time frames may have more false entry points.
Открыть график инструмента в новом окне
Triple Top
сформирован 08.04 в 02:00:05 (UTC+0)
сила сигнала 2 из 5
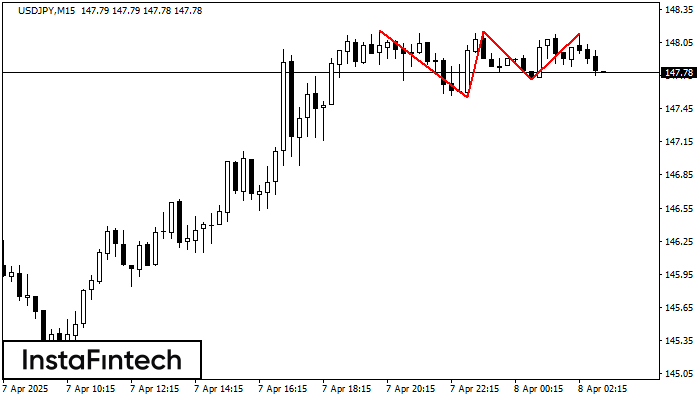
The Triple Top pattern has formed on the chart of the USDJPY M15 trading instrument. It is a reversal pattern featuring the following characteristics: resistance level 3, support level -17
The M5 and M15 time frames may have more false entry points.
Открыть график инструмента в новом окне
Triple Top
сформирован 08.04 в 01:40:24 (UTC+0)
сила сигнала 1 из 5
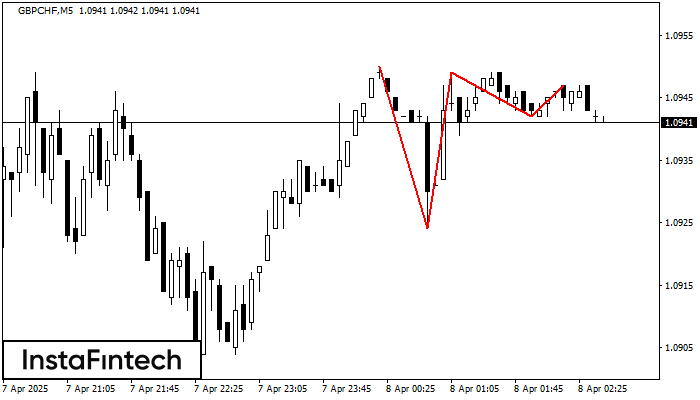
On the chart of the GBPCHF M5 trading instrument, the Triple Top pattern that signals a trend change has formed. It is possible that after formation of the third peak
The M5 and M15 time frames may have more false entry points.
Открыть график инструмента в новом окне


