

Dolzarb patternlar

Медвежий симметричный треугольник
сформирован 28.03 в 21:34:03 (UTC+0)
сила сигнала 1 из 5
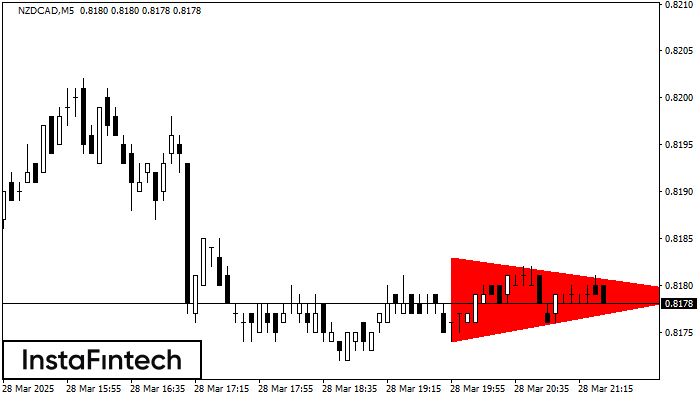
По NZDCAD M5 сформировалась фигура «Медвежий симметричный треугольник». Данная фигура сигнализирует нам о продолжении нисходящего тренда в случае пробоя нижней границы 0.8174, где вероятная прибыль будет являться шириной текущей фигуры -9 пунктов.
Таймфреймы М5 и М15 могут иметь больше ложных точек входа.
Shuningdek ko'ring
- Все
- Все
- Bearish Rectangle
- Bearish Symmetrical Triangle
- Bearish Symmetrical Triangle
- Bullish Rectangle
- Double Top
- Double Top
- Triple Bottom
- Triple Bottom
- Triple Top
- Triple Top
- Все
- Все
- Покупка
- Продажа
- Все
- 1
- 2
- 3
- 4
- 5
Triple Bottom
сформирован 13.06 в 16:30:35 (UTC+0)
сила сигнала 1 из 5
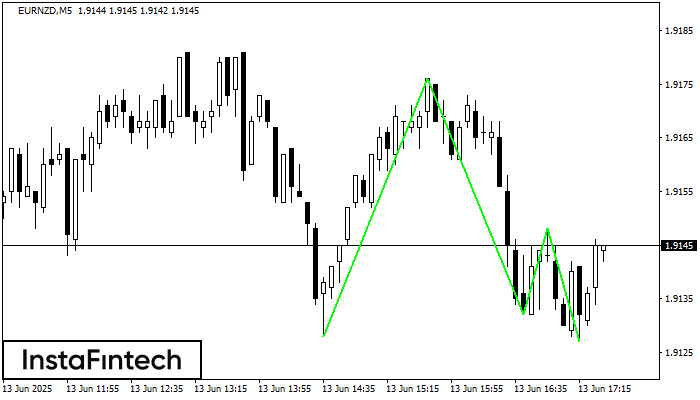
The Triple Bottom pattern has formed on the chart of the EURNZD M5 trading instrument. The pattern signals a change in the trend from downwards to upwards in the case
The M5 and M15 time frames may have more false entry points.
Открыть график инструмента в новом окне
Double Top
сформирован 13.06 в 16:00:24 (UTC+0)
сила сигнала 2 из 5
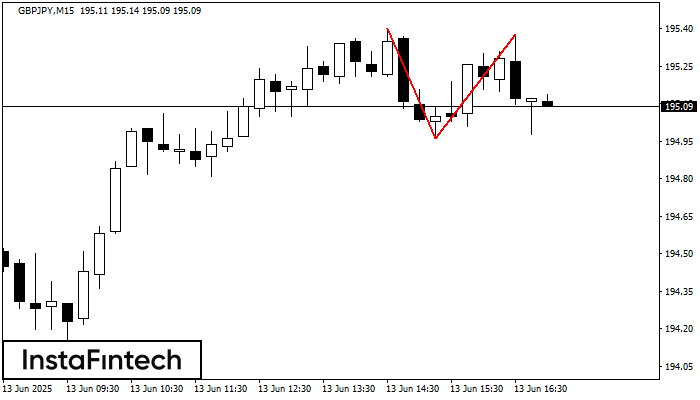
The Double Top pattern has been formed on GBPJPY M15. It signals that the trend has been changed from upwards to downwards. Probably, if the base of the pattern 194.96
The M5 and M15 time frames may have more false entry points.
Открыть график инструмента в новом окне
Double Bottom
сформирован 13.06 в 15:30:35 (UTC+0)
сила сигнала 5 из 5
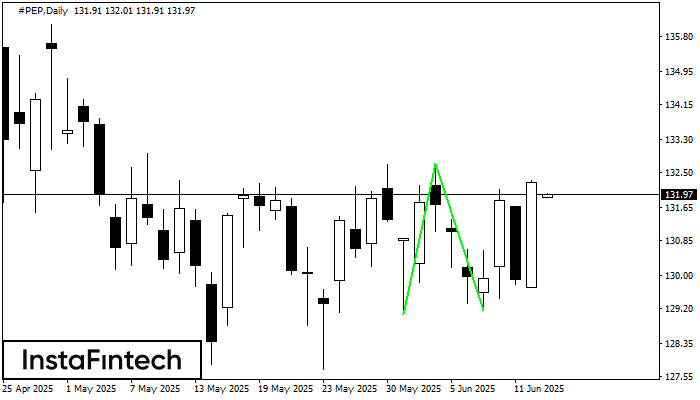
The Double Bottom pattern has been formed on #PEP D1; the upper boundary is 132.72; the lower boundary is 129.16. The width of the pattern is 365 points. In case
Открыть график инструмента в новом окне


